IGMPlot home
Independent Gradient Model Plot
By using
IGMPlot you can identify and quantify molecular interactions over a broad range: from non-covalent to covalent bonding, through metal coordination. This tool can be helpful for interpretation accessible to a wide community of chemists (organic, inorganic chemistry, including transition metal complexes and reaction mechanisms). It allows you for:
- Studying molecular systems from a wave function: wfn and wfx and adf.rkf files are supported (GTO and STO basis functions)
- Studying large systems like ligand-protein complexes from the atomic cartesian coordinates only
(promolecular ED computed by IGMPlot)
- Distinguishing between intramolecular and intermolecular interactions, covalent or hydrogen-
bonding or vdW interactions
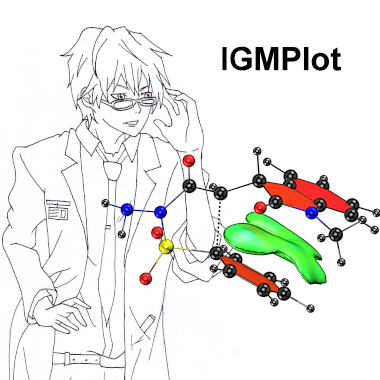
- Probing and quantifying interactions between two given fragments in a molecular system (both in
QM and promolecular modes), typically intramolecular π-π stacking can be revealed and quantified
- Determining the strength (IBSI) and asymmetry (PDA) of a given bond
- Estimating the atomic contributions to an intermolecular interaction (QM and Promolecular modes)
- Building isosurfaces representing the regions of space where the interactions take place
- Preparing data to build 2D and 3D representations of interaction regions in the molecular environment with software like VMD
- Monitoring interactions along molecular dynamics or along a reaction path
- Performing a critical point analysis
- ELF analysis (ELF&IGM method)
- SELF: spatial characterization of the steric effect together with a quantification and atomic decomposition
IGMPlot is a free open-source program.
From a practical perspective, an attractive feature of the IGM approach is to provide an automatic workflow delivering properties that provides chemists with a visual and quantitative understanding of interactions. Although IGMPlot relies on the ED topology, no topological analysis is required and an IGM analysis can be achieved with little preparation
The IGM-δg approach relies on the new definition of a non-interacting system in term of ED contragradience (“ED
clash” between two sources). More precisely, the new descriptor, δg, represents locally the difference between a
virtual upper limit of the ED gradient (∇ρ
IGM) representing a non-interacting system and the true ED gradient (∇ρ). An attractive feature of the new IGM methodology is to provide an uncoupling scheme that automatically extracts the signature of interactions between two given fragments (δg
inter), or inside these fragments (δg
intra), or between two atoms (δg
pair).
Feedback : please feel free to report errors, omissions, corrections in IGMPlot code or in the supporting documentation.
Note : a GPU accelerated version of NCI (cuNCI) has been written by our group and be can downloaded
here.

______________________________________________________________________________________________