back to summary
-
You can access the necessary files for this tutorial by downloading this
archive. Once downloaded, place it in a convenient location and extract its contents:
[user]$ tar -xvjf 7_cp.tbz2
Unpacking the archive will create a directory called 7_cp/, wherein this tutorial will be conducted. - The results of the calculations can be found in this archive_results.
VII. Critical point search
Go to directory 7_cp/A feature of IGMPlot is to perform a critical point (cp) search, i.e. to search for those points in space where the electron density (ED) gradient vanishes. This kind of information is of importance within the Atom In Molecule (AIM) analysis proposed by Bader. Determining such critical points in a molecule is of high importance in many studies aiming at characterizing bonds by properties at cp like energy densities (kinetic, potential) or the ED Laplacian, or ellipticity, . . .
The eigenvalues of the Hessian matrix (λ1, λ2, λ3) of the ED evaluated at these specific points determine their rank (number of nonzero eigenvalues) and their signature (the algebric sum of the sign of the eigenvalues). In molecules, most generally, the rank is 3 with four possible signatures:
- (3,−3): all curvatures of the ED are negative, the ED is a local maximum, associated with the nuclei position, a so-called Nuclear Critical Point (NCP).
- (3,−1): two curvatures are negative and one is positive, associated with so-called ”bond critical points” (BCP); ED is accumulated at the cp in the plan perpendicular to the internuclear axis.
- (3, +1): two curvatures are positives and one is negative, associated with so-called ”ring critical points” (RCP).
- (3, +3): the three curvatures of the ED are positive, associated with so-called ”cage critical points” (CCP).
1) Critical points in the benzene dimer
Change to directory 1_benzeneDimerWe are going to find the critical points of the benzene dimer (parallel displaced conformation). The wave function is stored in the file mol.wfx.
Edit and save the following param.igm input file (the file param.igm must be located in the same directory as the mol.wfx file supplied for you):
1
mol.wfx
CRITIC
- 1 --> one single file describes the system
- mol.wfx --> the name of this file --> here, the electron density (ED) will be calculated from a wave function
(note the the old wfn file format is also supported by IGMPlot) - CRITIC --> the critical point analysis is requested
Provided that you have installed IGMPlot (see documentation for installation instructions): run the program IGMPlot with the command in a linux terminal:
-> IGMPLOT param.igm > igm.log &
The calculation may take a few seconds.
The resulting list of files in the current directory is:
cp.vmd --> vmd script to visualize critical points
igm.log --> IGMPLot output
mol-coord.xyz --> cartesian coordinates of the molecule
mol-cp.txt --> properties calculated at critical points
mol.wfx
param.igm
VMD visualization of critical points
To materialize the location of points in space, we are going to use the vmd script automatically generated by IGMPlot: cp.vmd.Run VMD and load the cp.vmd session file (menu File/load Visualization state). The benzene dimer appears in “ball & sticks” representation. Press “S” to scale the picture, “T” to translate or “R” to rotate. The critical points are represented as small coloured spheres: Yellow for BCP, Orange for RCP and Purple for CCP.
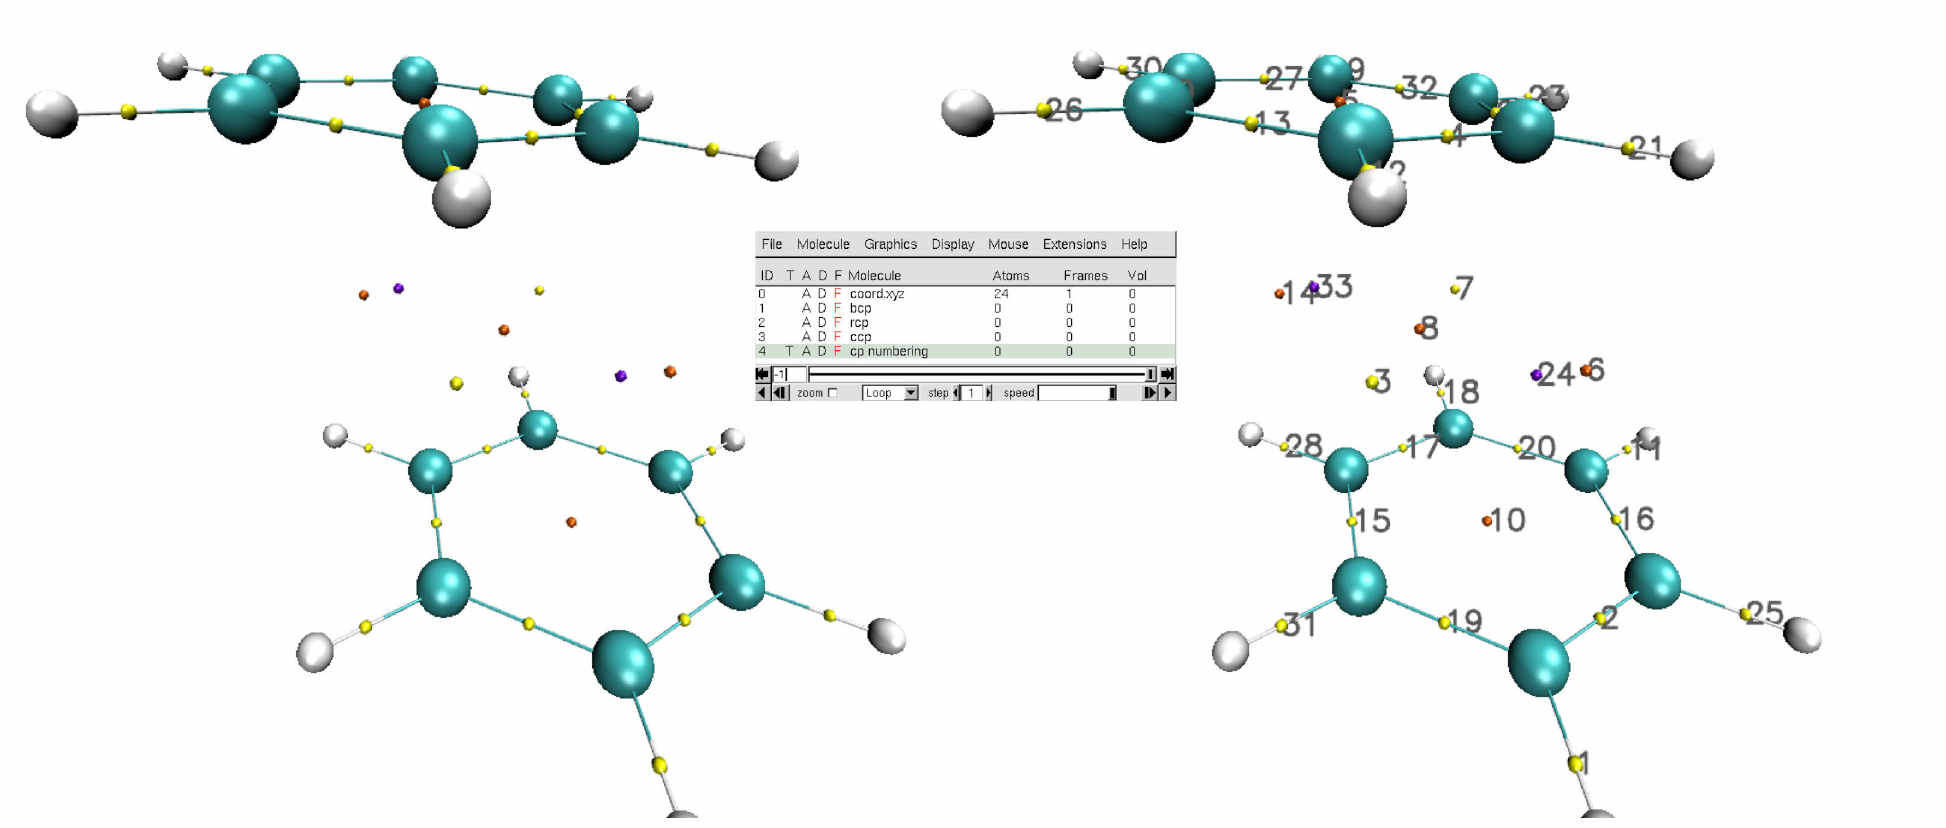
Each critical point is accompanied with a numbering on the VMD molecular viewer. This facilitates locating the critical points in the cp.txt file where properties are reported for them.
5 representations are given in the VMD main window:
- coord.xyz: the molecular system
- bcp: bond critical points
- rcp: ring critical points
- ccp: cage critical points
- cp numbering
Critical point analysis
A summary of the critical point analysis is provided in the igm.log file.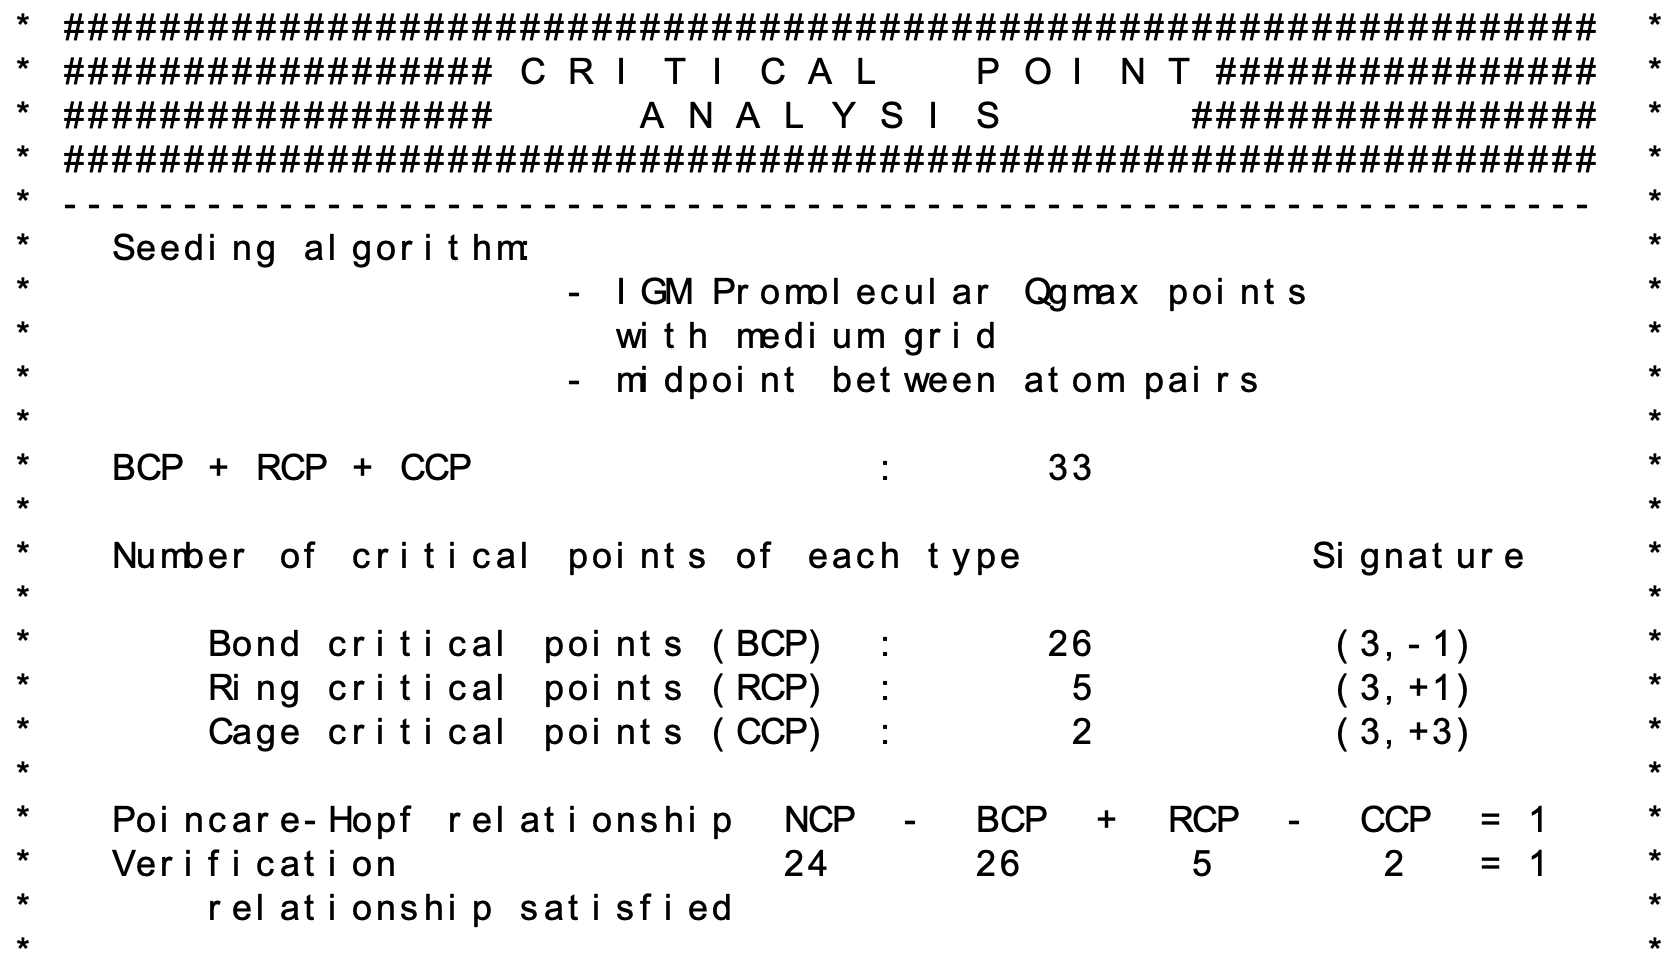
Note that IGMplot checks if the Poincaré-Hopf relationship: NCP - BCP + RCP - CCP = 1 is satisfied.
Properties at critical points
In addition to the xyz position, the ED, its gradient, δg, the three eigenvalues of the ED hessien λ1, λ2, λ3, the laplacian, the kinetic energy density G, potential energy density V and energy density H (= G+V) are reported in the cp.txt file. For BCP, the ellipticity is also given.
2) Second example
Change to directory ../2_dicationThe pentagonal pyramidal structure of an unconventional structure (unstable at room temperature) was previously confirmed by using X-ray crystallography and DFT calculations. It can be formally thought of as being composed of the two cations C5(CH3)5+ and CH3C+ (see Figure below).
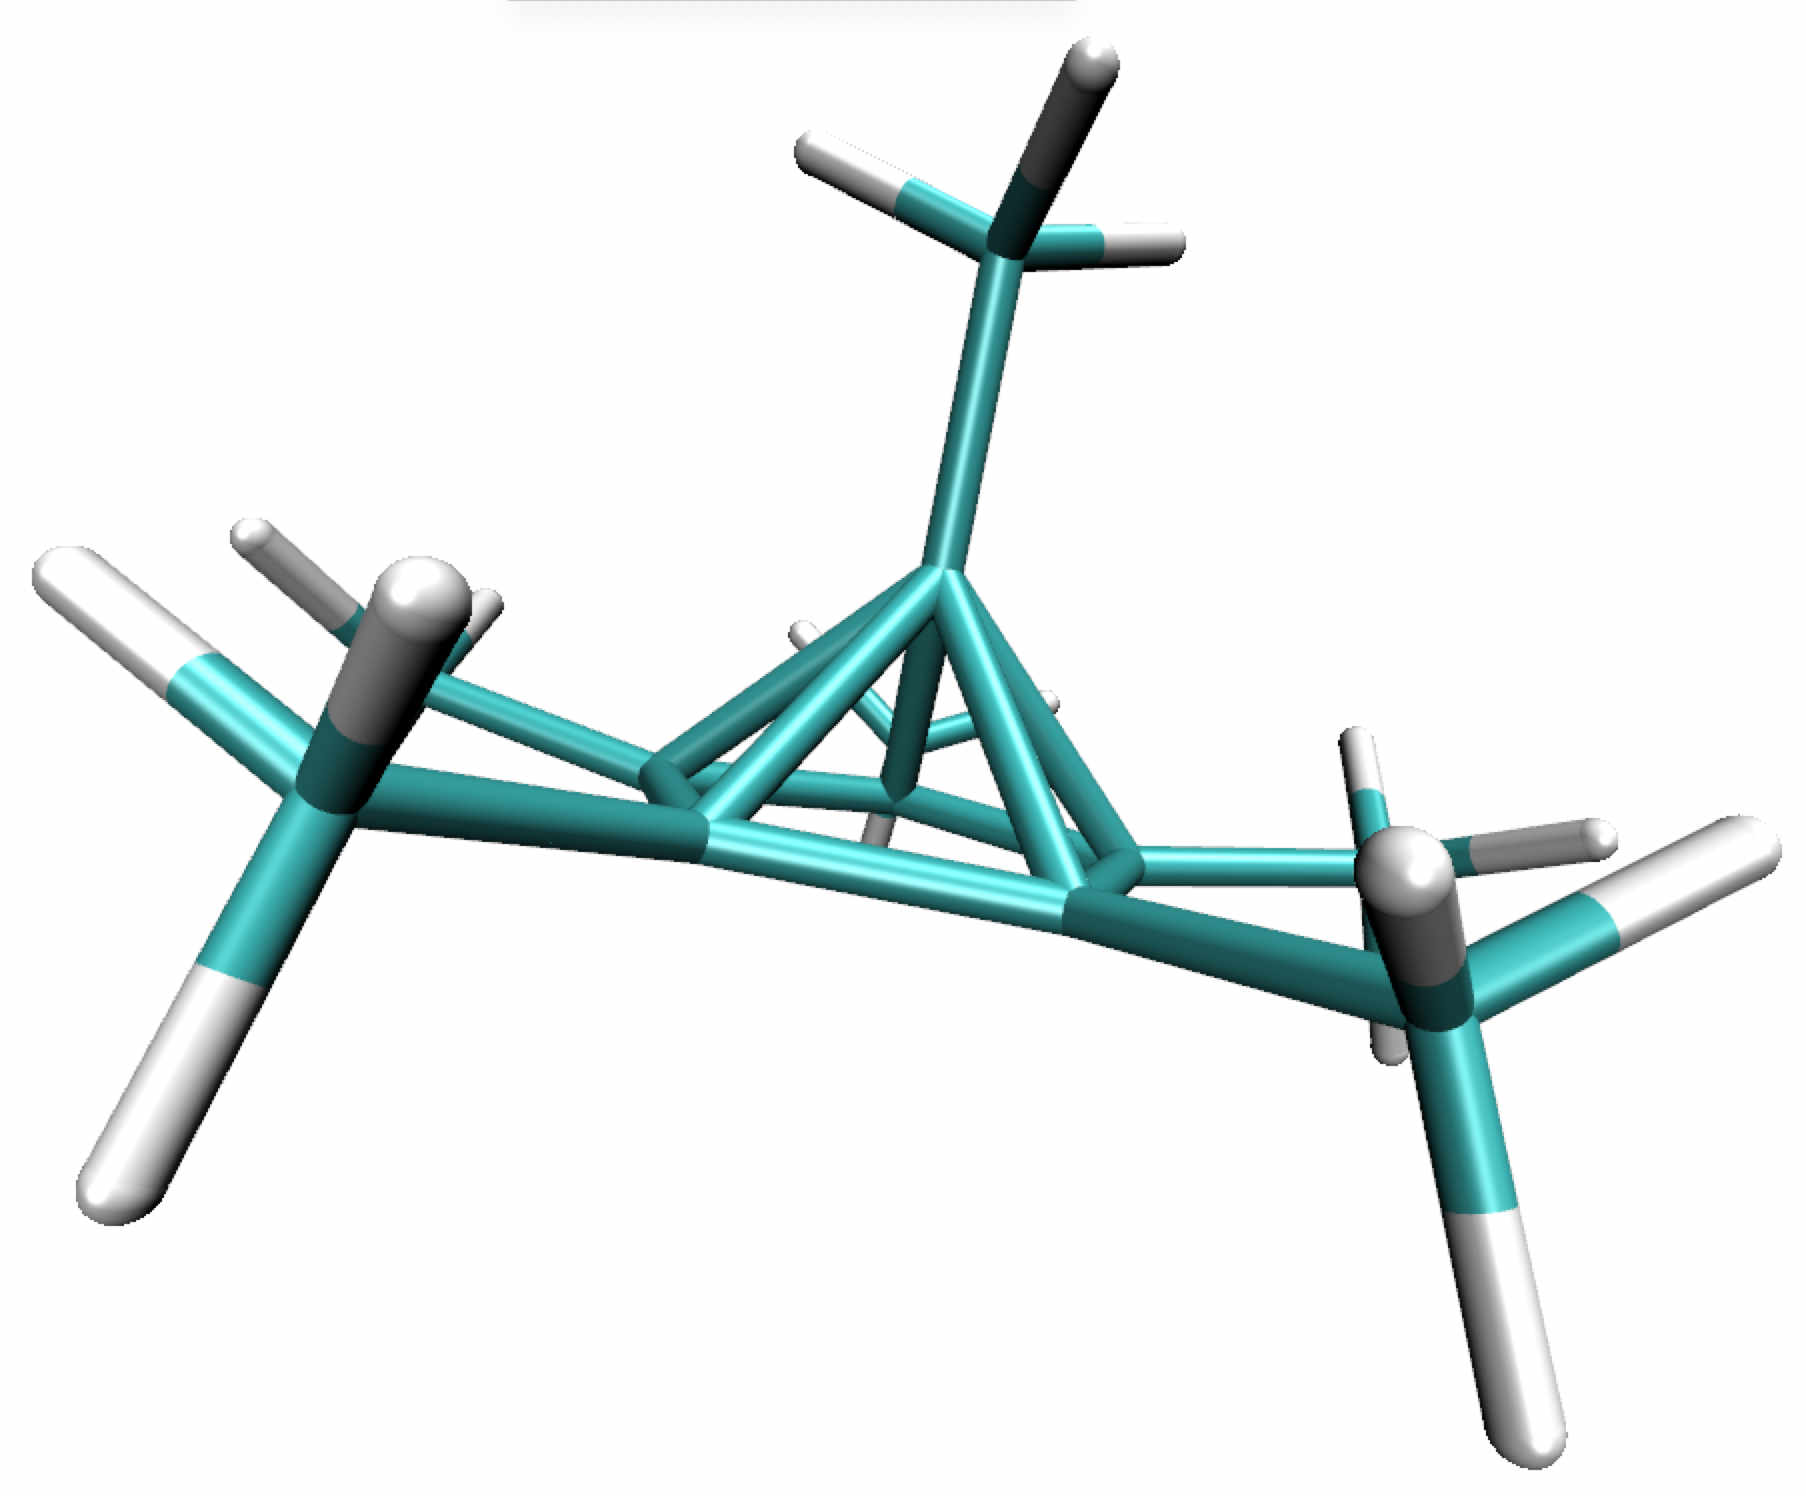
In this system the interaction between the apical carbon and the five-membered ring below him involves a hexacoordinated carbon atom. The very unusual interaction of this apical carbon prompted us to investigate the bonding situation in this molecule by using the critical point approach and the IGM approach.
a) Critical point analysis
Change to directory: a_criticWe are going to check if bond critical points are detected on the 5 lines joining the apical carbon to the five carbon atoms of the five-membered ring. The wave function of the system is stored in the file mol.wfn.
Edit and save the following param.igm input file (the file param.igm must be located in the same directory as the mol.wfn file supplied for you):
1
mol.wfn
CRITIC
-> IGMPLOT param.igm > igm.log &
The calculation may take a few seconds.
VMD visualization of critical points
To materialize the location of points in space, we are going to use the vmd script automatically generated by IGMPlot: cp.vmd.Run VMD and load the cp.vmd session file (menu File/load Visualization state).
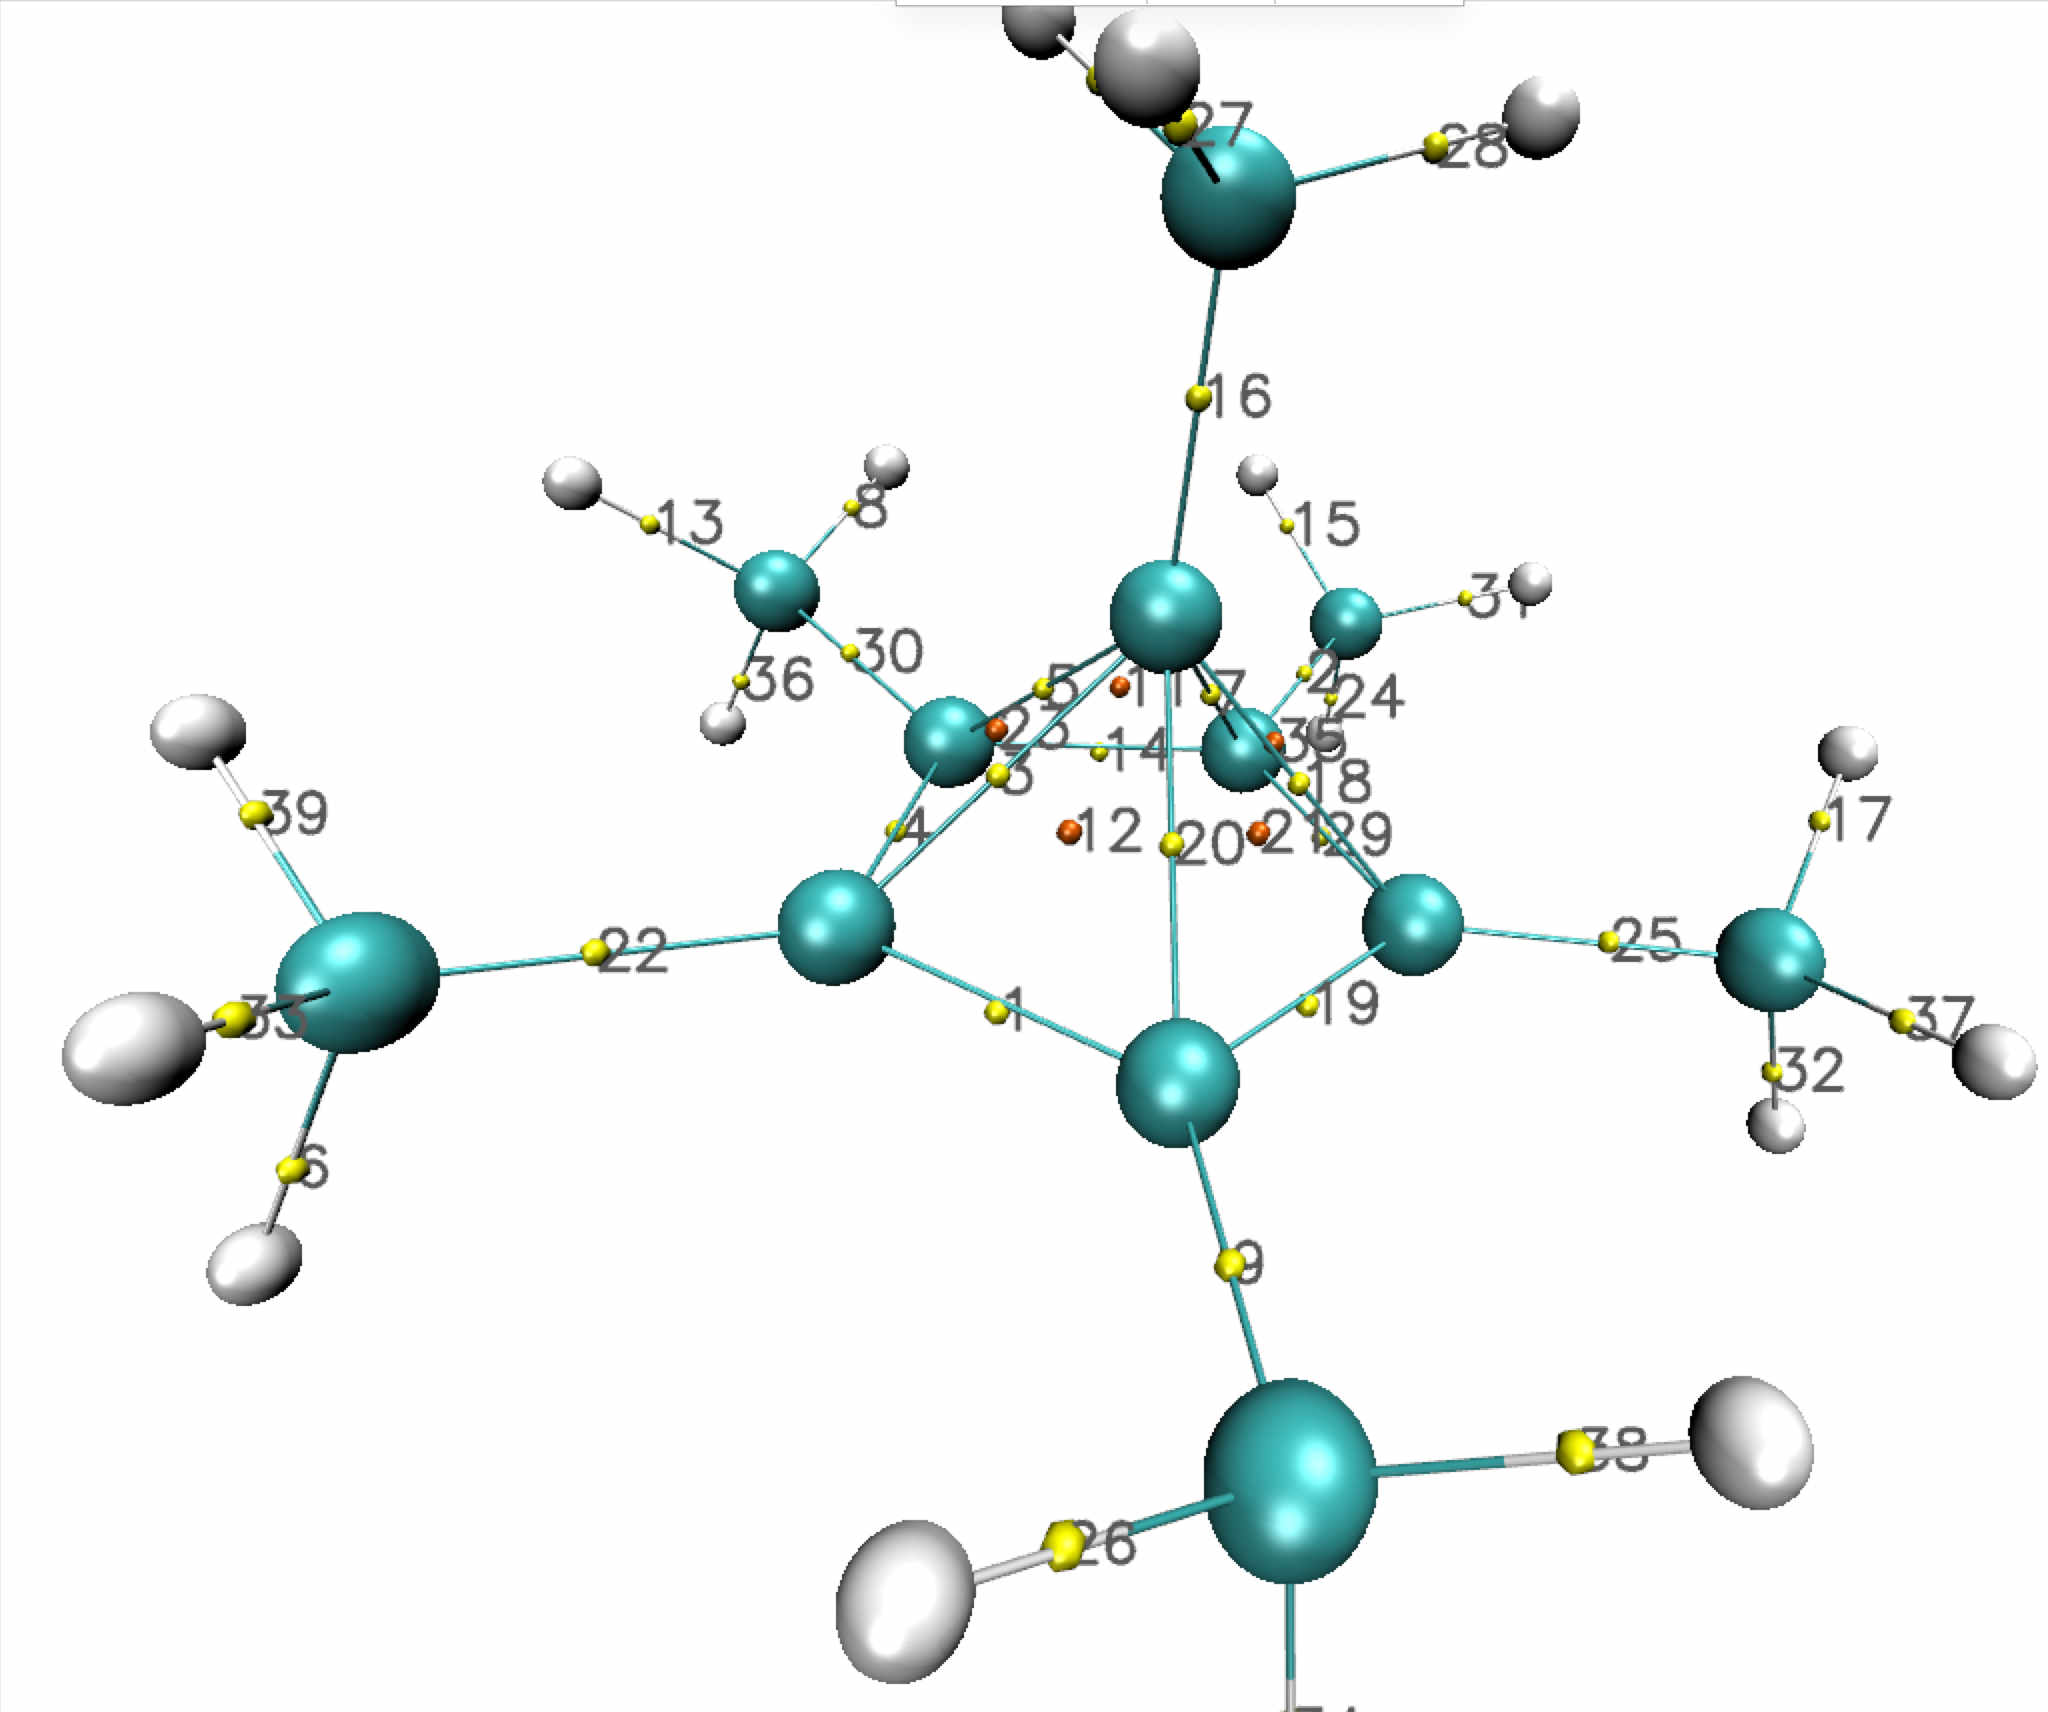
Around the apical unconventional carbon, the critical point analysis discloses:
- alternating BCPs (5 yellow points) and RCPs (5 orange points) along a "pseudo"-ring located above the five-membred ring plane.
- a single BCP towards the methyl group above the apical carbon.
Examining properties at Bond Critical Points
In order to compare the 6 C-C "bonds" around the apical carbon, we are going to look at the ellipticity descriptor reported in the mol-cp.txt output file. Let us recall that the ellipticity measures the departure from the cylindrical symmetry as in π-bonding for example. A value of 0 means: pure cylindrical feature.The ellipticity found for the 5 C-C "bonds" on the five lines joining the apical carbon to the five-membered ring is: 2.968, 3.525, 2.927, 3.328 and 3.238, thus describing a bond feature far from the cylindrical symmetry. In contrast, the apical C-CH3 bond has an ellipticity value of: 0.0: purely cylindrical, typical of a single σ bond.
Another way of looking at bond is the Laplacian of the electron density taken at the BCP. A negative value of the Laplacian points out a covalent character while a positive one indicates non-covalent features. Here, we find very very small values: -0.004, 0.007, -0.005, 0.003 and 0.001 for the 5 C-C "bonds" on the five lines joining the apical carbon to the five-membered ring, meaning: almost no covalent character for these 5 C-C pairs. In contrast, the apical C-CH3 displays a Laplacian value of -0.643, pointing a covalent bond.
Finally, the electron density (ED) at BCP for the apical C-CH3 bond is about 0.25 a.u. while the 5 C-C "bonds" of the pentagonal pyramidal structure feature a smaller value, about 0.15 a.u.. While smaller, the latter is however significant compared to the ED at BCP for non-covalent interaction like hydrogen-bond (generally one order of magnitude less, 0.02). So, according to the ED criterion found at BCP, some covalent character would be expected for these 5 unconventional bonds.
b) IGM Fragment analysis
Go to directory ../b_IGM_FragTo probe the interactions around the controversial apical carbon, several IGM calculations are now carried out.
First, in order to probe all the interactions around the apical carbon (atom number 10), two fragments are defined to implement the uncoupling IGM scheme of IGM: 1) the apical atom alone (FRAG1) and 2) the rest of the molecule (FRAG2).
Edit and save the following param.igm input file (the file param.igm must be located in the same directory as the mol.wfn file supplied for you):
1
mol.wfn
FRAG1 10;
Run the IGMPlot program with the following command in a linux terminal:
-> IGMPLOT param.igm > igm.log &
The calculation may take a few minutes.
The resulting list of files in the current directory is:
- igm.log: text outputfile of the IGM execution
- igm.vmd: VMD script to automatically display δg 3D isosurfaces
- mol-dens.cube: cube file describing the electron density (ED) at each node of the grid
- mol-dgInter.cube: cube file describing the δg_inter value at each node of the grid
- mol-dgIntra.cube: cube file describing the δg_intra value at each node of the grid
- mol-igm.dat: file with data in columns to be used with GNUPLOT to generate 2D-fingerprints
- mol-nci.dat: file with data in columns to display the RDG=f(ED) 2D-plot
- mol-RDG.cube: cube file describing the Reduced Density Gradient value at each node of the grid
- nci.vmd: VMD script to automatically display RDG 3D isosurfaces
- mol.xyz: the xyz cartesian coordinates of the system
- AtContribInter.vmd: the atomic contributions to the interactions between the two fragments
2D-fingerprint
We are now going to analyse the interfragment interaction 2D-fingerprint. Edit the mol-igm.dat output file with a text editor and have a look. Six columns can be used to plot the δg-fingerprint:- Column 1: signed ED
- Column 2: RDG (for NCIplot representation)
- Column 3: δg-intra descriptor: quantifies the interactions inside each fragment
- Column 4: δg -inter: quantifies the interactions between the two fragments
- Column 5: qg-intra descriptor: the 'quotient' twin descriptor of δg-intra
- Column 6: qg-inter descriptor: the 'quotient' twin descriptor of δg-inter
set xlabel "sign({/Symbol l}_2){/Symbol r} (a.u.)" font "Helvetica,18" offset 0.0, 0.1
set ylabel "{/Symbol d}g (a.u.)" font "Helvetica,14" offset 0.2, 0.0
set palette rgbformulae 22,13,-31
set cbrange[1:4]
set xrange[-0.25:0.1]
set yrange[0:2]
plot "mol-igm.dat" u 1:4:6 every ::1 notitle pt 7 ps 0.8 palette
Meanings of the GNUPLOT commands
- set xlabel ... --> sets the x axis label
- set ylabel ... --> sets the y axis label
- set palette rgbformulae 22,13,-31 --> palette definition to color each point
- set cbrange[1:4] --> range of the qg color scale (1 <-> no interaction)
- plot: GNUPLOT command to plot data contained in a file
- "mol-igm.dat": the name of the file where to retrieve the data to be plotted
- u 1:4:6 --> using columns 1 (signed ED), 4 (δg_inter) and 6 (qg_inter)
- every ::1 --> skips line 1 (the header of mol-igm.dat)
- notitle: no title will be displayed on the plot
- pt 7: point type number 7
- ps 0.8: point size
- notitle: no title will be displayed on the plot
The resulting INTER 2D-fingerprint is:
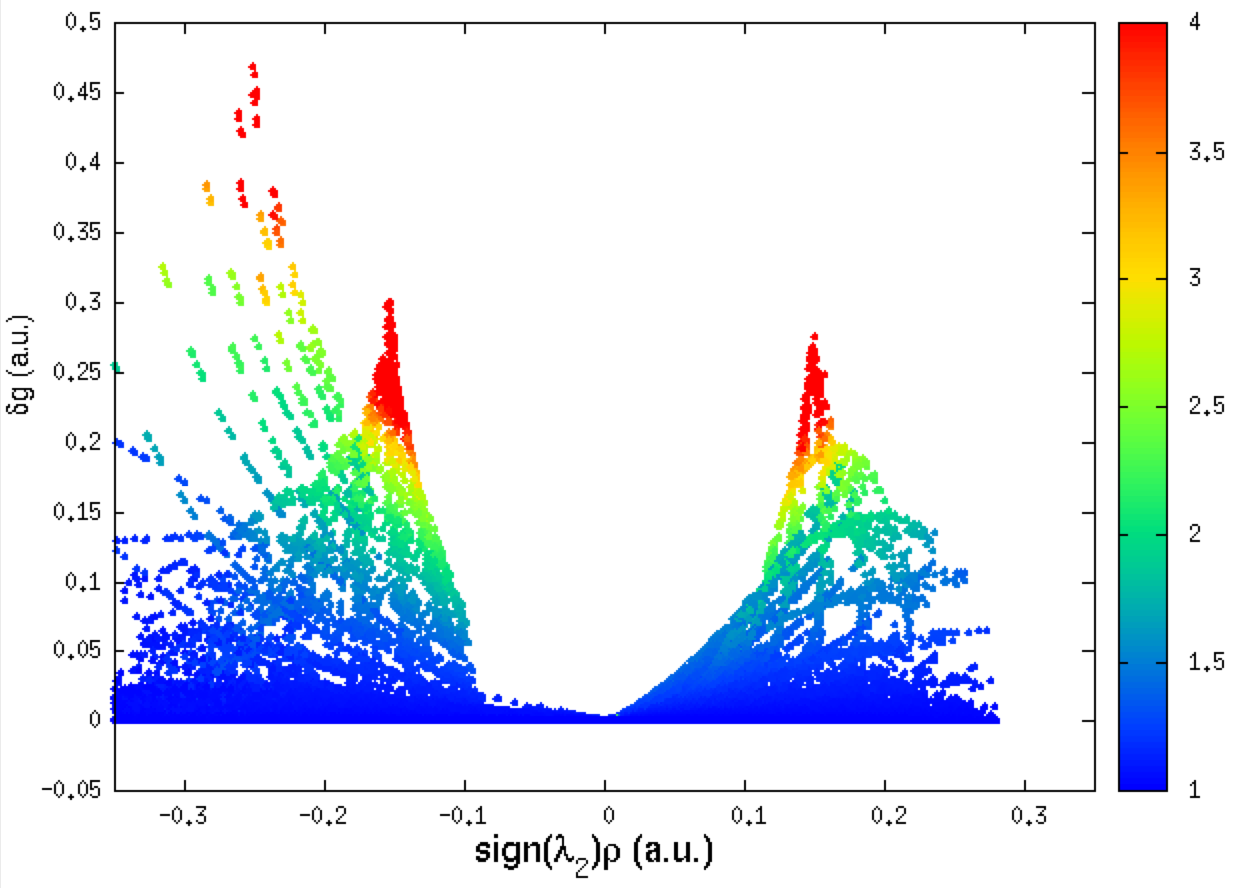
Remind that the negative side of the plot corresponds to interactions occuring in binding regions. One peak = one interaction. The larger the peak, the greater the interaction.
As you can see, IGMPlot detects two kinds of interactions on the attractive side of the 2D-fingerprint (2 peaks): one with a δg peak value of 0.46 a.u., and a smaller one with a δg peak value of 0.28 a.u.. According to the IGM δg_peak scale:
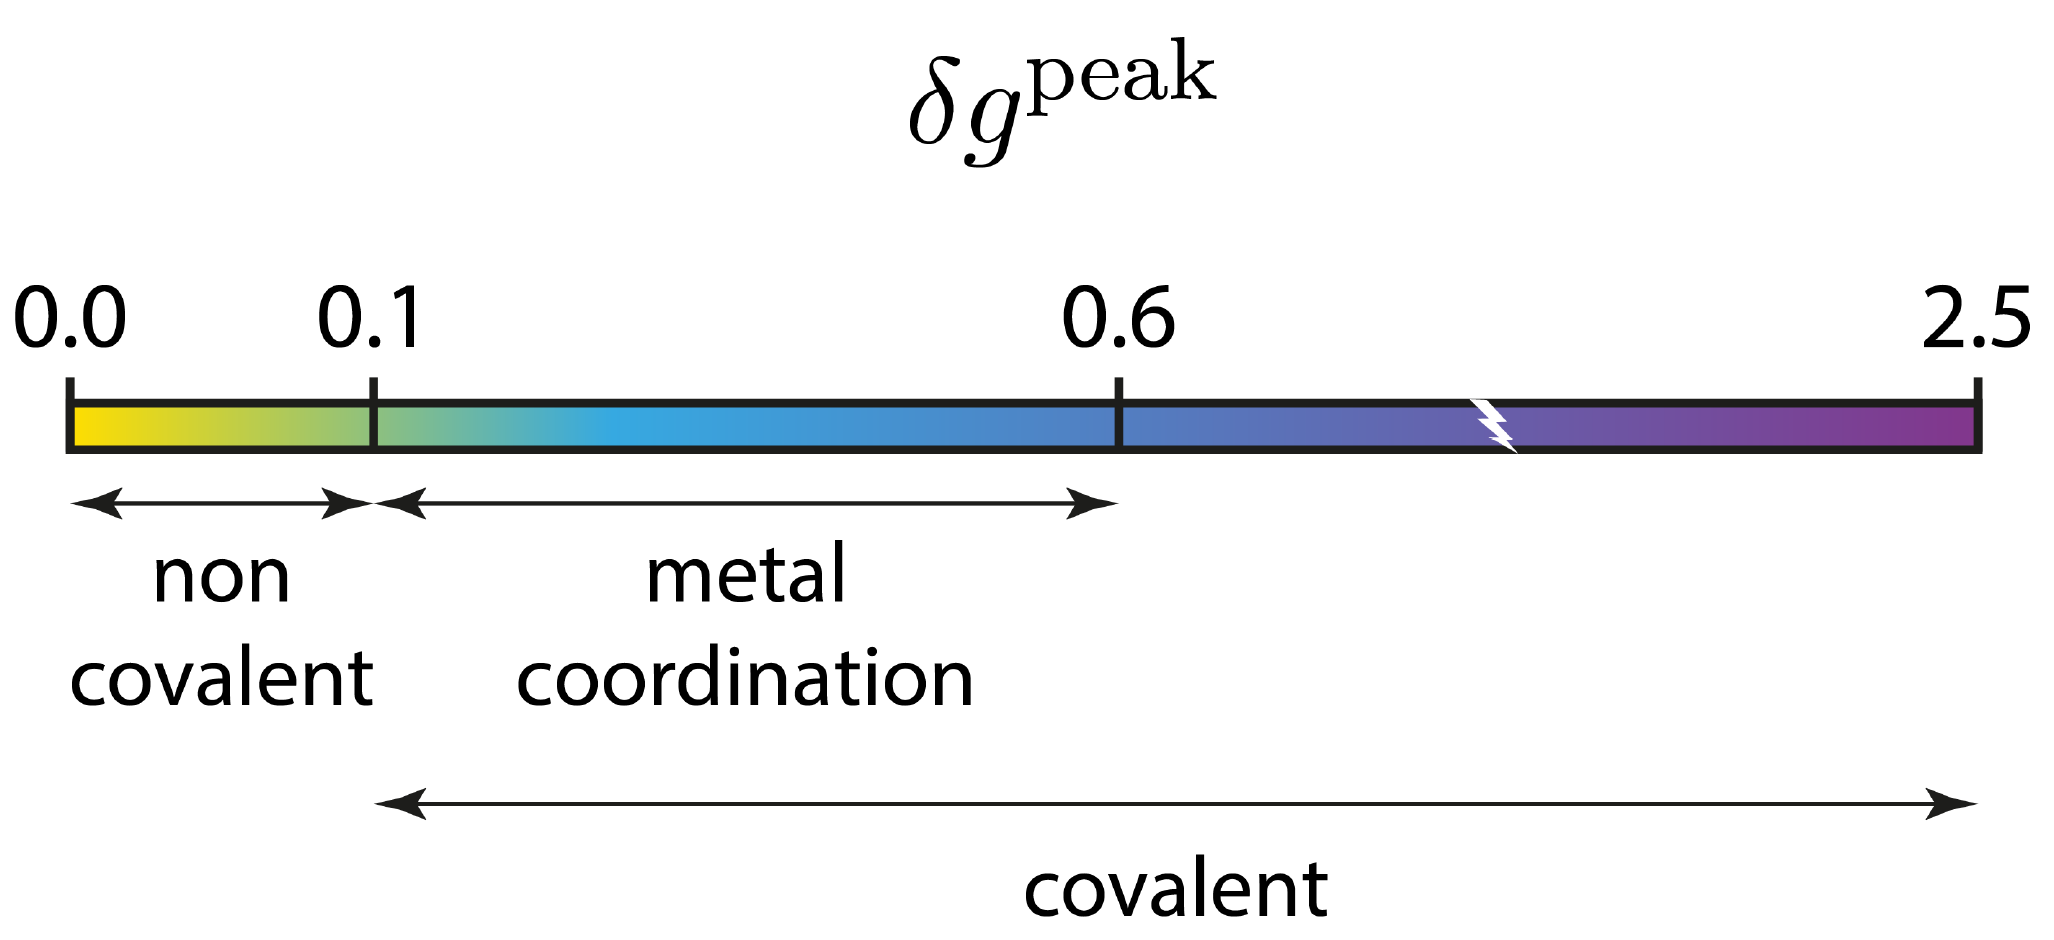
these two peaks correspond to covalent interaction situations.
On the positive side of the plot, one single peak appears, only slightly smaller (δg_peak = 0.26 a.u.) than the second peak in the attractive part of the plot. It corresponds to interactions taking place in non-bonding regions of the system.
3D-isosurfaces
We are now going to examine the regions of space where interactions take place between the apical carbon and the rest of the dication. The script igm.vmd is used. It was automatically generated by IGMPlot during the IGMPlot calculation.The igm.vmd file file must be located in the folder containing the cube files while running VMD. Run VMD and load the igm.vmd session file (menu File/load Visualization state). Two windows appear: the VMD main window and the molecular viewer.
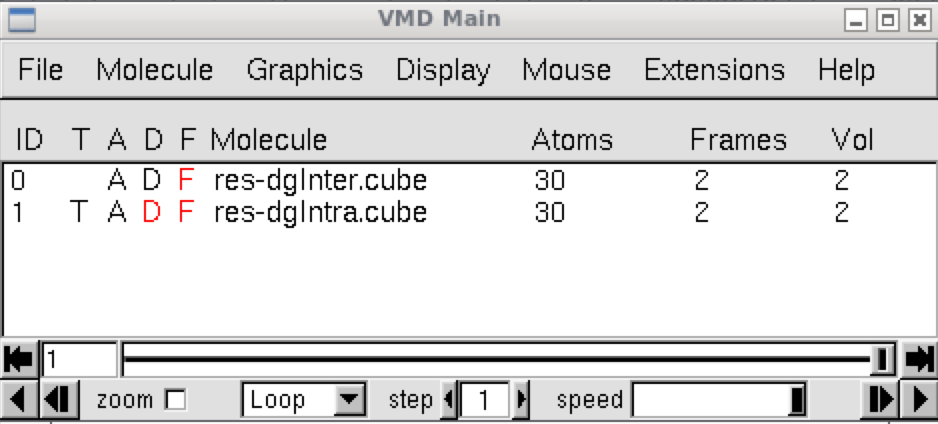
In the VMD main panel appear two “Molecules” lines (res-dgInter.cube and res-dgIntra.cube). Default of the script igm.vmd is to display the interactions between fragments: resdgInter.cube Molecule (button D is activated). Here, owing to the FRAGMENTS definition, default is then to display the interactions between the apical carbon and the rest of the molecule.
The molecular system appears in the molecular viewer in “ball & sticks” representation. Press “S” to scale the picture, “T” to translate or “R” to rotate.
The resulting δg_inter isosurfaces clearly reveals two regions of interaction (two envelopes).
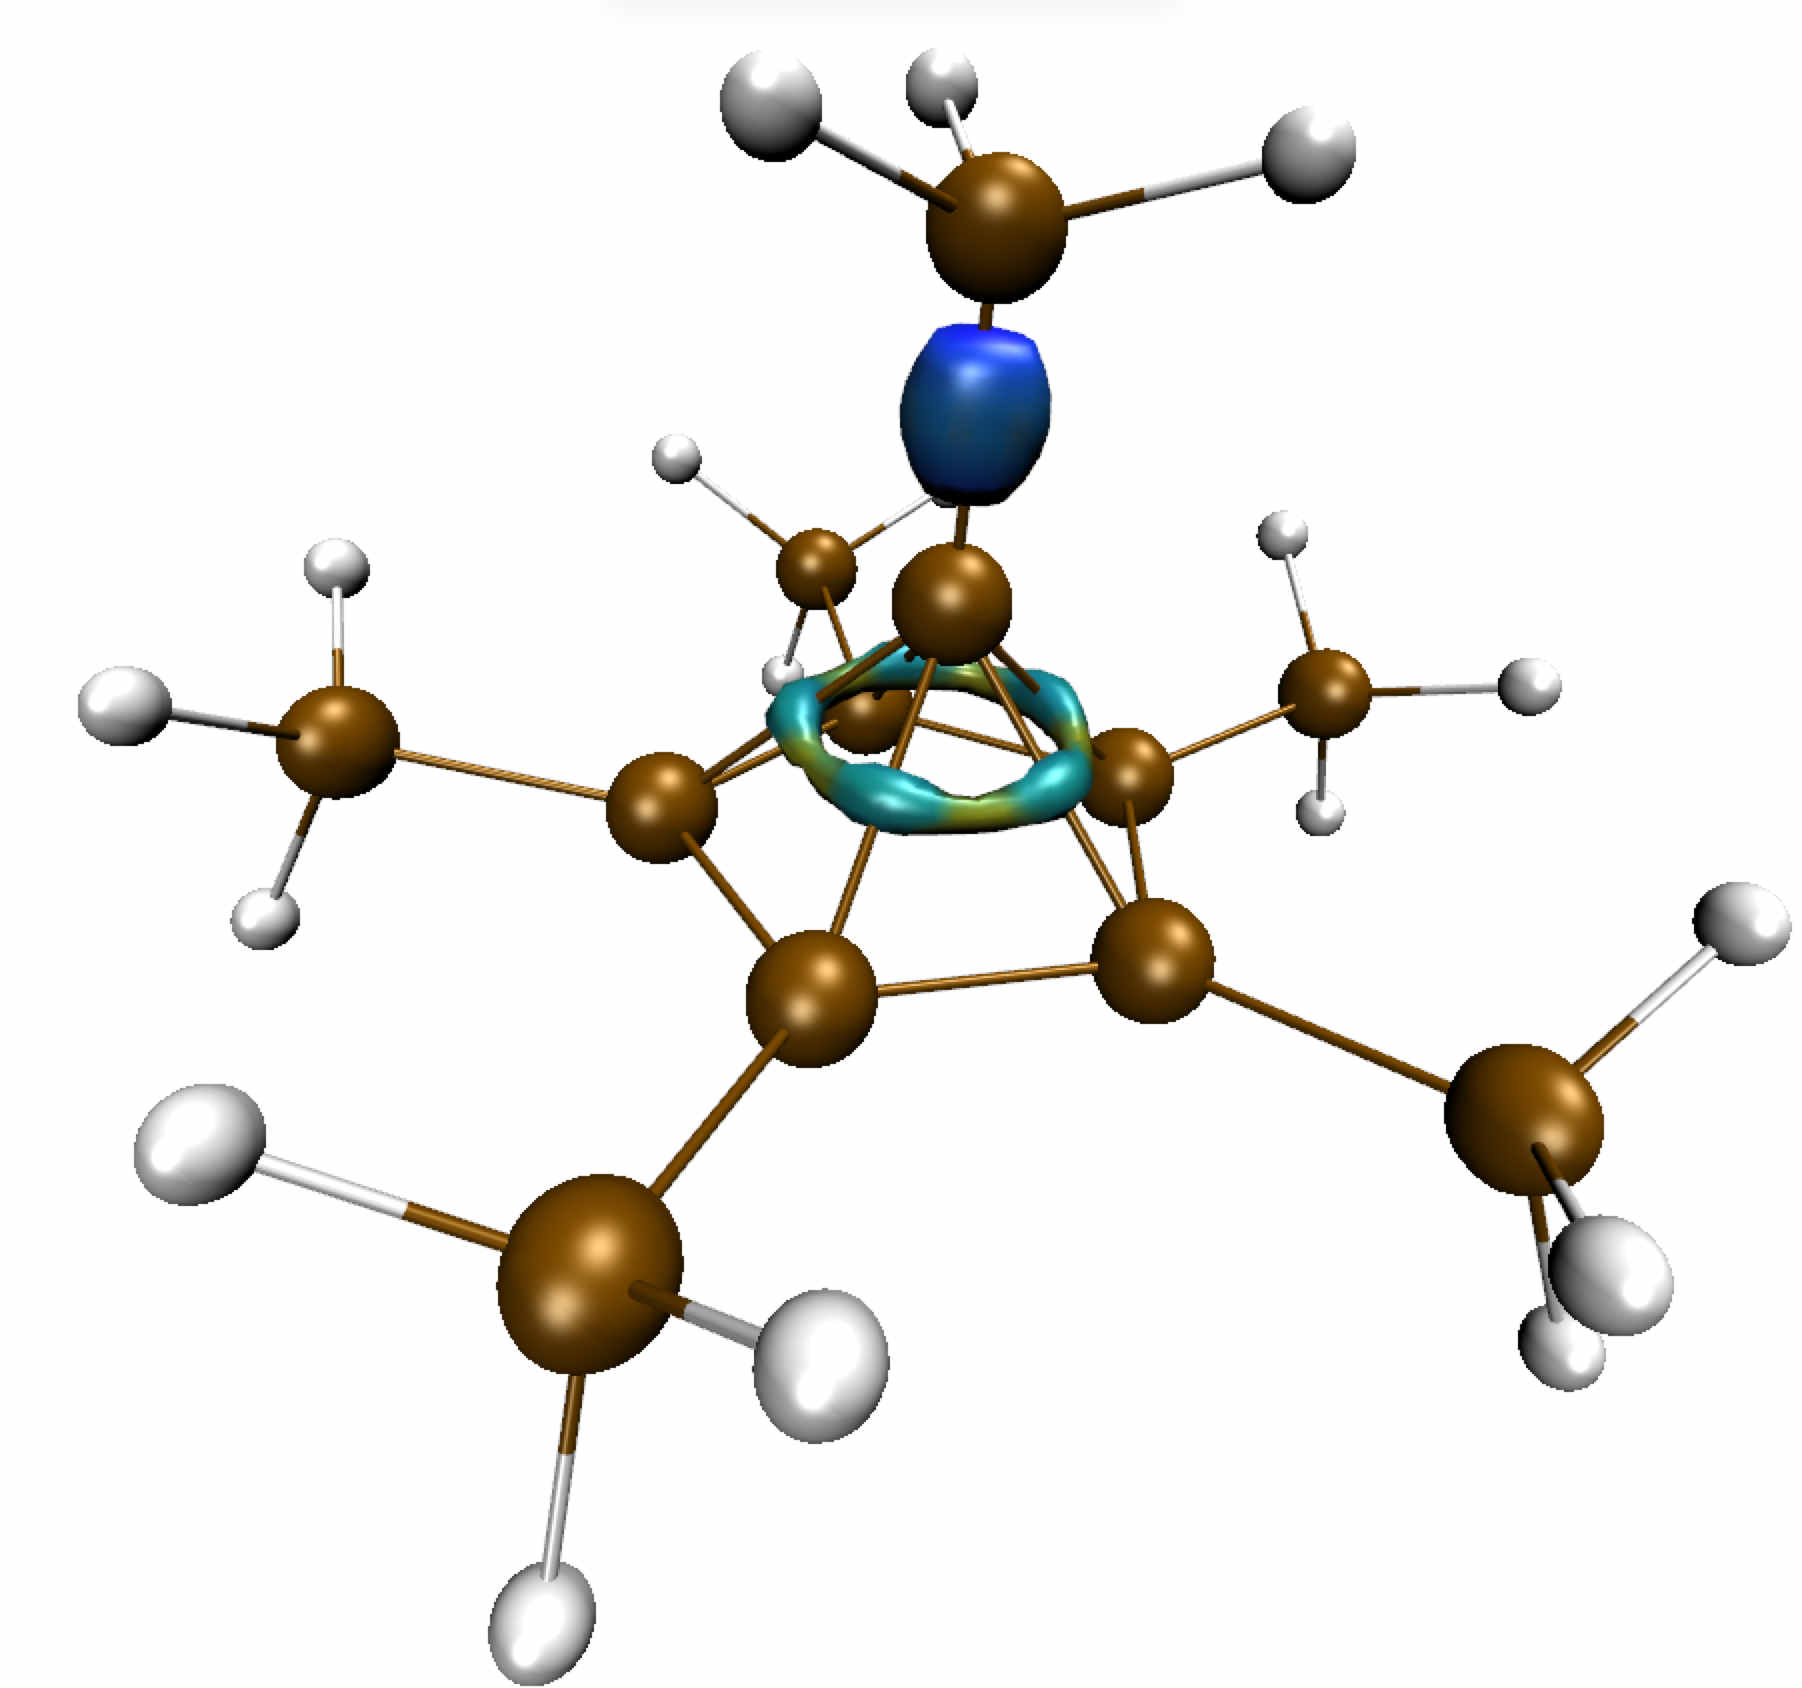
Since δg captures ED clash between different sources (atoms, fragments, molecules) such δg isosurfaces give rise to a coherent picture with stabilizing interactions accumulated in the center of the envelope.
Note: the default δg isovalue = 40% of the maximum peak height found by IGMPlot in the 2D-finger-print. Changing the iso-value will change the size of the isosurfaces. To do that, go to the menu Graphics/Representations, select 0:res-dgInter.cube in the "Selected Molecule" scrolling menu, then select the “Isosurface” representation (by clicking on it) and change the “Isovalue” number in the panel, to gradually grow or diminish the volume enclosed in the envelops. The larger the isovalue, the larger the ED interaction.
In other respects, the isosurface are colored according to the ED signed by the second eigenvalue of the ED hessien (λ2) on a BGR color scale: Blue = bonding region, Red = non-bonding, Green = very weak interactions (flat green isosurfaces are generally associated to vdW interactions). It is recommended to set the color scale data range according to the ED domain in which the peaks appear in the 2D-fingerprint, i.e. [-0.35:0.35] in our case (see 2D-fingerprint above). To do that:
- go to the menu Graphics/Representations, select 0:res-dgInter.cube in the "Selected Molecule" scrolling menu
- select the tab "Trajectory"
- set the lowerlimit and upperlimit of the Color Scale Data Range to -0.35 and 0.35, respectively.
As you can see, this analysis unveils a conventional covalent bond between the apical carbon and the CH3 apical group above: a strong ED contragradience is actually observed in between these two carbon atoms, associated with an identified binding region (blue color). This interaction clearly corresponds to the larger peak on the 2D-fingerprint. To check this, in VMD, starting from a very large δg_inter isovalue, for instance 0.5, (menu Graphics/Representations/ 0:res-dgInter.cube in the "Selected Molecule" scrolling menu/“Isosurface” representation/Isovalue) you can gradually lower the isovalue until an isosurface appears (from a δg_inter isovalue of 0.46).
The smaller signal of the 2D-fingerprint is associated to the unconventional pyramidal C-C bonds experimentally observed in this compound. To check this, keep lowering the selected isovalue (as explained above in VMD): the second region of interaction will then appear (from a δg_inter isovalue of 0.28). The interaction takes the form of a ring envelope on the 3D representation. In other words, the electron sharing between the apical carbon and the five-membered ring C5 is in fact delocalized above the C5 ring. Although smaller (δg_peak = 0.28), the ED contragradience between the apical carbon and each of the five carbon atoms of the five-membered ring is much larger than in non-covalent interaction (δg_peak_non_covalent < 0.1 on the IGM δg peak scale).
A careful analysis of the ring δg_inter isosurface shows that, according to the sign of λ2, the ED contragradience detected by IGMPLot occurs in an alternating sequence of attractive (blue-green) and repulsive (green-yellow) areas. This is fully in agreement with the QTAIM analysis, which disclosed alternating bond critical points (BCPs) and ring critical points (RCPs) along a ring located above the C5 plane. The BCPs located on the five lines that join the apical carbon to the basal carbons correspond to the attractive part of the δg_inter signal. The repulsive part is associated to the five RCPs located between these lines. Looking closer at the 3D representation , it appears that electron sharing assigned to attractive interactions along the five lines of the pyramid roof (δg_inter peak = 0.28) expands over a slightly greater volume than the one that occurs in repulsive areas (δg_inter peak = 0:26). These two types of interaction counterbalance, and the net effect is slightly stabilizing and responsible for the (weak) cohesion observed experimentally for this compound.
♥ Always check the intra-representation to make sure that your FRAG1/FRAG2 definition meets your needs. To do so, double-click in the VMD main menu on the "D" letter facing the res-dgIntra.cube system, and simultaneously disable the res-dgInter.cube system (by double-clicking in the VMD main menu on the "D" letter facing the res-dgInter.cube system).
c) IGM bond strength analysis
We are now going to compare the bond strength of several C-C bond in this unconventional system.The IBSI (Intrinsic Bond Strength Index) score provides a quantitative bridge between the local electron density-based descriptor δg and the physically grounded bond strength concept.
IBSI is dimensionless and it is normalized to 1 for H2. Our work has shown that the IBSI is not a bond order (like Mulliken, Wiberg, Mayer, delocalization index or ELF). it does not represent a number of electron pair shared between two atoms. Thus, the values of IBSI should absolutely not be compared to those of bond orders. Rather, it is a new complementary index, related to the bond strength. The IGM-IBSI procedure has been extensively tested with a wide range of molecules and IBSI has been shown to have a very strong correlation with the local stretching force constant. This represents an important advancement in bond strength analysis. A key benefit of this approach is that it provides a bond strength value that is specific to the considered atom pair, unlike traditional harmonic vibrational analysis which yields force constants that are spread over multiple atoms. Also, the conventional force constant is no longer attached to the restoring force concept in transition state situation, while the IBSI index is still attached to the notion of bond strength in that case. Thus, IBSI allows us for internally probing bond strength in TS structures and along reaction pathways for breaking and forming bonds. IBSI covers a broad range of bonding situations. Edit and save the following param.igm input file:
1
mol.wfx
IBSI
1 10
2 10
3 10
4 10
5 10
10 12
1 11
1 2
ENDIBSI
- IBSI/ENDIBSI: keyword to start/end the IBSI section
- 1 10 --> bond strength between atoms 1 and 10 is requested
♥ You can simultaneously probe the strength of several bonds in one single calculation, simply by adding a line for each bond.
In a linux terminal run the IGM analysis from the supplied wfx wave-function input file:
--> IGMPLOT param.igm > igm.log &
This calculation will take a few minutes (using 28 cores). To save time, you can perform bond strength calculations separately (in parallel) by limiting the IBSI/ENDIBSI section to a single bond within each run.
Note that here, only the igm.log outputfile is generated. Actually, since a cylindrical grid is employed to perform the IBSI calculation, no “cube” file can be generated to draw δg isosurfaces (VMD only makes use of “rectangular” grids).
As can be seen from the results reported in the igm.log file, we oberve 4 kinds of C-C bonds:
| apical C - CH3 (above) | IBSI = | 0.869 |
| apical C - C5 (C of the five-membered ring) | IBSI = | 0.532 |
| C5 - C5 (in the five-membered ring) | IBSI = | 0.979 |
| C5 - CH3 | IBSI = | 0.870 |
This IGM-IBSI analysis confirms the relative weakness of the C-C bond along the lines joining the apical carbon to the C5 ring (IBSI = 0.532, much lower than a conventional single C-C bond with IBSI = 0.870). However, in line with the previous δg_peak analysis, this unconventional apical carbon - C5 bond is not a non-covalent interaction. Actually, the indicative IBSI scale is:
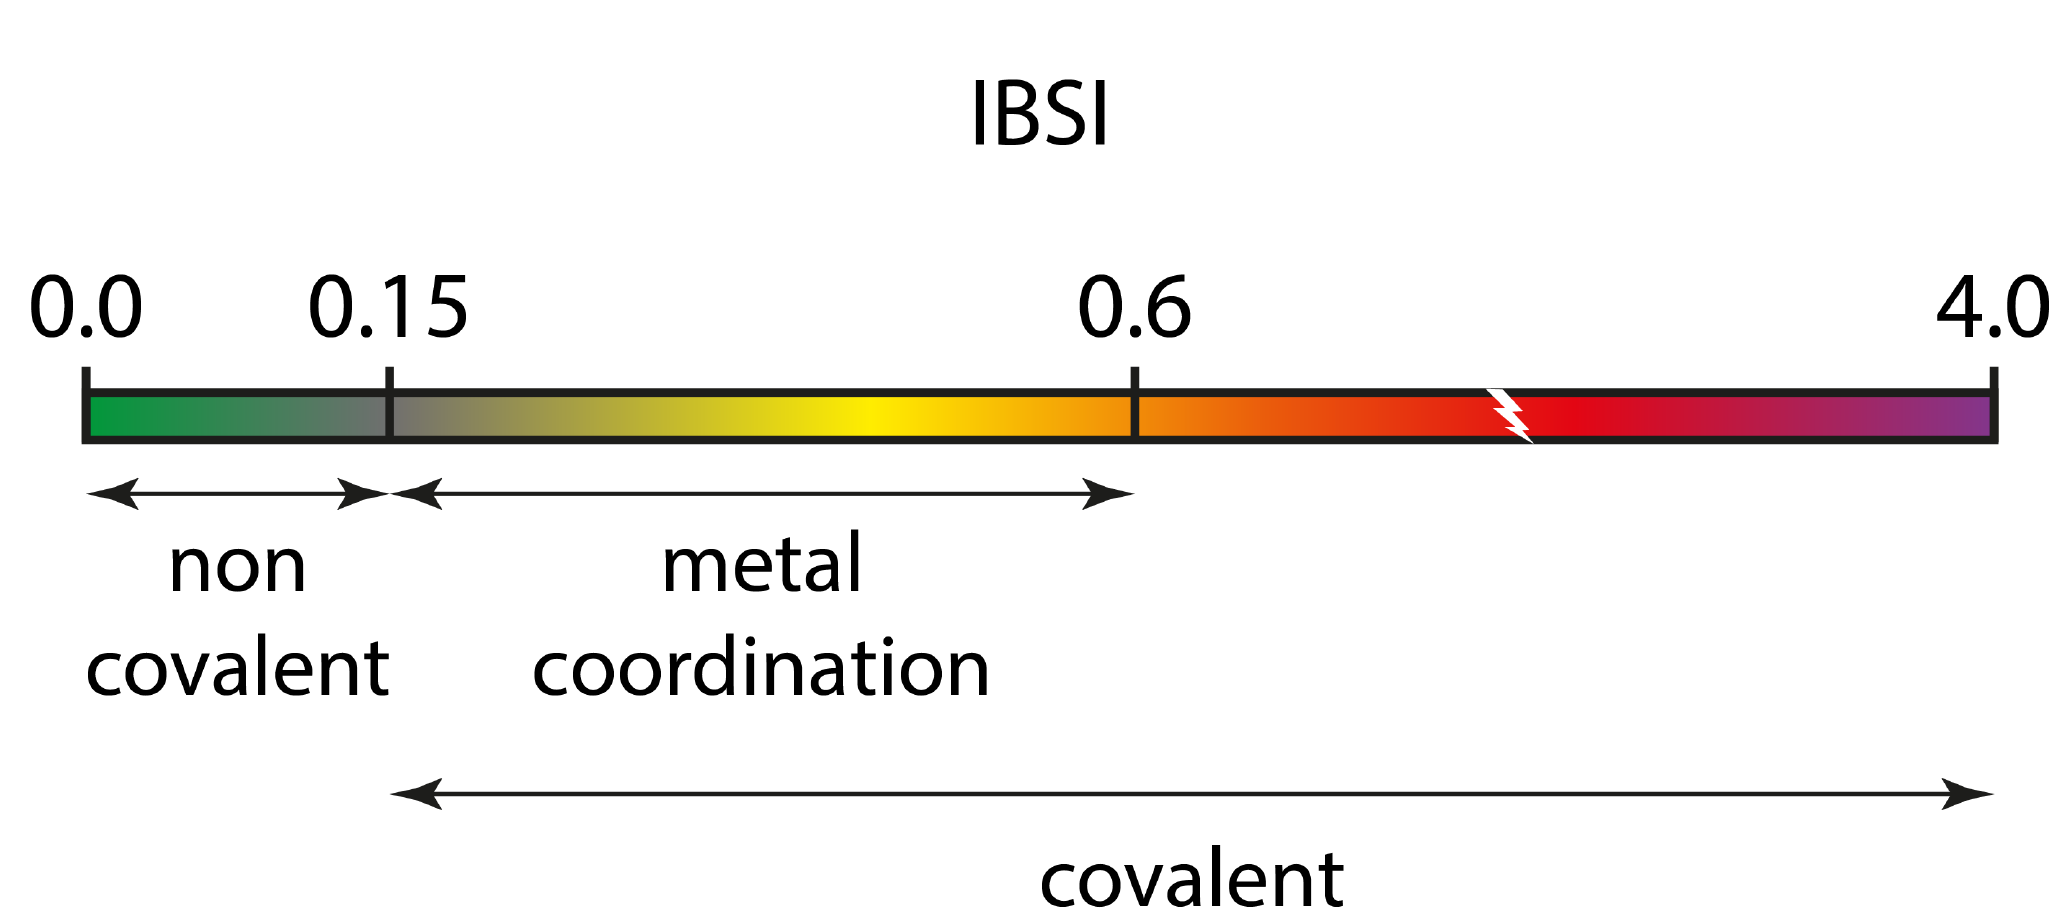
In other respects, the C-C bonds forming the five-membered ring are stronger than single C-CH3 bonds, but not that much. In line with this result, the ellipticity at BCP of these "in-ring" C-C bonds (ellipticity = 0.15 > 0) unveils a π character of these "in-ring" bonds.