back to summary
-
You can access the necessary files for this tutorial by downloading this
archive. Once downloaded, place it in a convenient location and extract its contents:
[user]$ tar -xvjf 6_lig_Prot.tbz2
Unpacking the archive will create a directory called 6_lig_Prot/, wherein this tutorial will be conducted. - The results of the calculations can be found in this archive_results.
VI. Ligand … Protein interactions
Go to directory 6_lig_Prot/This is an example of ligand-protein interaction (PDE4D metallo-protein). We will see how to estimate the interaction energy of one given hydrogen-bond “lost” in the set of several contacts between a ligand and a protein. We will proceed in 2 steps:
(a) Revealing all the interactions present between the two partners
(b) Focusing on the desired H-bond.
a) Revealing all the interactions between the ligand and the protein
Change to directory 1_allInterThe cartesian coordinates of the ligand and the protein are stored in the files lig.xyz and prot.xyz, respectively.
Edit and save the following param.igm input file (the file param.igm must be located in the same directory as lig.xyz and prot.xyz supplied for you):
2
lig.xyz
prot.xyz
INCREMENTS 0.2 0.2 0.2
- 2 --> two files describing the two fragments in interaction
- lig.xyz --> the name of the first file
- prot.xyz --> the name of the second file
Noticed that we have chosen a large grid increment (0.2 Angströms in each direction) in order to speed up the calculation (default increment is 0.1). Also, since two file names with .xyz file extension have been supplied, the electron density (ED) will be calculated at the promolecular level.
Run the IGMPlot program with the following command in a linux terminal:
-> IGMPLOT param.igm > igm.log &
The calculation may take 1 or 2 minutes depending on the number of available cores.
♥ Specify the ligand first (lig.xyz) in the param.igm input file! in order for the program to build the grid around the ligand and not around the protein, which is a large edifice!. Actually, the grid encompassing the molecular system is always constructed around the file supplied in first position in param.igm. This will save much CPU time.
2D-fingerprint
We are now going to generate the interaction 2D-fingerprint. This signature characterising the interaction between the ligand and the protein is built from the mol-igm.dat input file by plotting the δg_inter (column 4) descriptor as a function of the signed ED (column 1).Edit the mol-igm.dat output file with a text editor and have a look. Six columns can be used to plot the δg-fingerprint:
- Column 1: signed ED
- Column 2: RDG (for NCIplot representation)
- Column 3: δg-intra descriptor: quantifies the interactions inside each fragment
- Column 4: δg -inter: quantifies the interactions between the two fragments
- Column 5: qg-intra descriptor: the 'quotient' twin descriptor of δg-intra
- Column 6: qg-inter descriptor: the 'quotient' twin descriptor of δg-inter
In a Linux terminal, type the command gnuplot and next (in the gnuplot environment):
set palette rgbformulae 22,13,-31
set cbrange[1:4]
set xrange[-0.05:0.05]
plot "mol-igm.dat" every ::1 u 1:4:6 notitle pointtype 7 ps 0.8 palette
- set palette rgbformulae 22,13,-31 --> palette definition to color each point
- set cbrange[1:4] --> range of the qg color scale (1 <-> no interaction)
- set xrange[-0.05:0.05] --> limit the x range to -0.05 to +0.05
- plot: GNUPLOT command to plot data contained in a file
- "mol-igm.dat": the name of the file where to retrieve the data to be plotted
- every ::1 : skipps the first line (header)
- u 1:4:6 --> using columns 1 (signed ED), 4 (δg_inter) and 6 (qg_inter)
- pt 7: point type number 7
- lw 3: line width
- ps 1.2: point size
- notitle: no title will be displayed on the plot
- palette --> color according to column 5
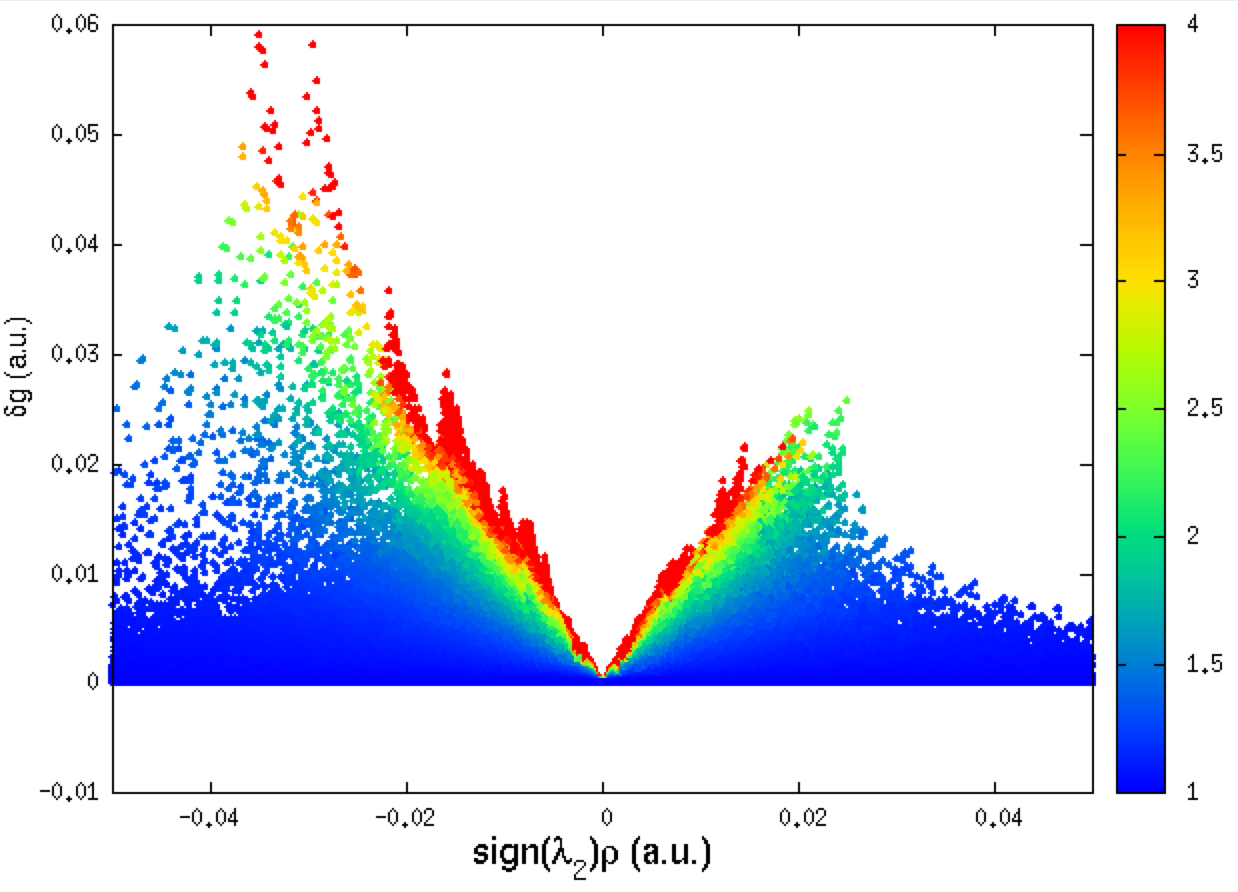
(this Figure has been obtained with smaller INCREMENTS of 0.1 (instead of 0.2 in the above param.igm input file, the resolution is then larger)
Remind that the negative side of this plot corresponds to interactions occuring in binding regions. One peak = one interaction. The larger the peak, the greater the interaction.
The 2D-fingerprint is relatively complex, with many peaks falling in the low ED domain. This means that we are dealing with a multiple biomolecular recognition, with different features. Peaks are relatively small on the δg peak scale of the IGM approach (δg is lower than 0.1 a.u.), meaning that we are dealing with weak interactions.
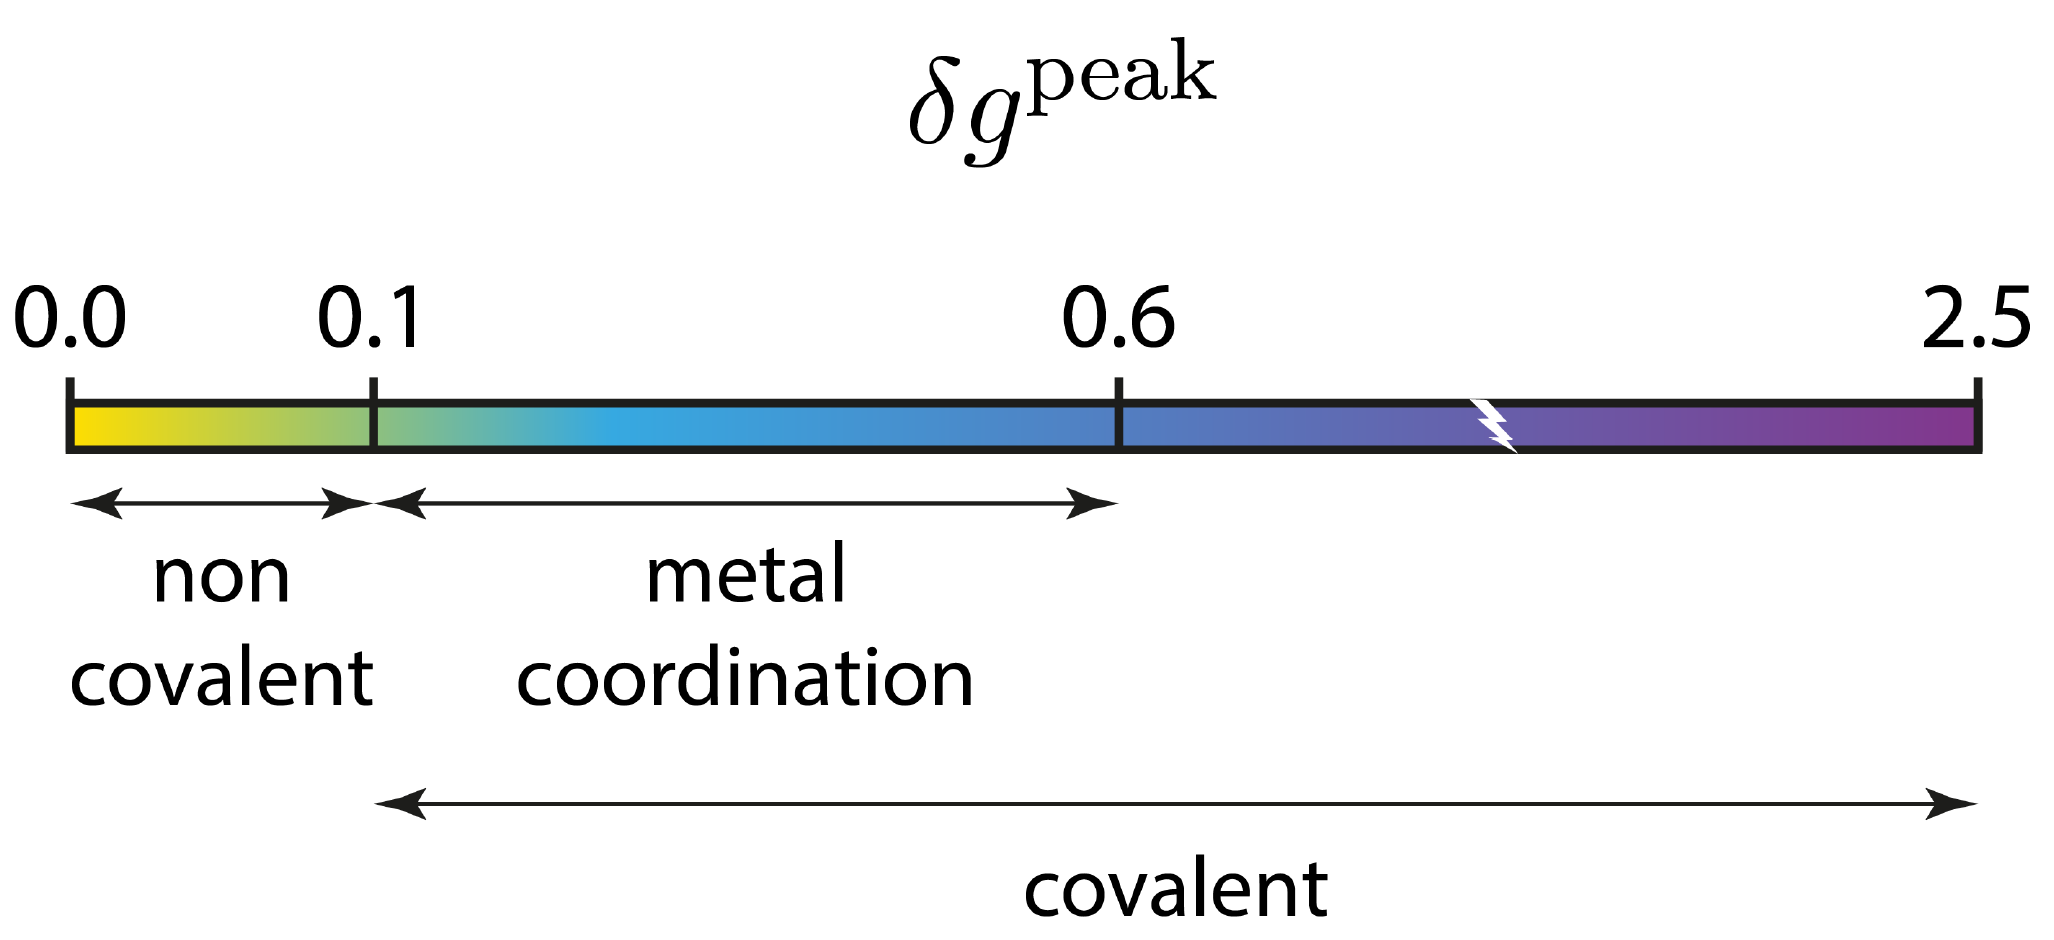
The 3D analysis will bring more information later on in this tutorial.
Reading igm.log
Edit the igm.log output file. Go to the "INTER" section (remind that the INTRA section describes covalent features, which are meaningless here since we are using the non-relaxed promolecular electron density (ED)).Remember that, the greater δg, the strongest the interaction. Note that in the INTER section, IGMPlot first reports the largest δg_inter peak detected: 5.8021e-02 a.u. (attractive part). On the IGM δg peak scale, this corresponds to a non-covalent interaction.
Next, several scores are given. Herafter are described the meanings of these scores.
The score [1] corresponds to the full integration of δg. Thus, every point in the grid is taken into account, and all the δg values are summed and weighted by the elementary volume dv of each grid cell. The [1a] score is the same as [1] except that only those points of the grid for which λ2 > 0 are considered. The [1b] score is the same as [1] except that only those points of the grid for which λ2 < 0 are considered. Thus, [1] = [1a] + [1b]. The separated scores [1a] and [1b] have been implemented upon user request since the sign of λ2 is used in the original NCI paper by Yang to characterise the kind of interaction in the interatomic regions (bonding situation when λ2 < 0 and non-bonding when λ2 > 0).
Next, the score [2] (similar to [1b]) corresponds to the integration of grid points for which λ2 < 0 and for which the signed electron density rho : -0.09 < ρ < 0.09 and for which qg > 1.3. This score aims at extracting and quantifying only weak interactions in a given 2D-plot signature. Here, IGMPlot detects some weak interactions between the ligand and the protein. The latter condition allows to get a score focusing only on the peaks of the 2D-plot fingerprint, removing points of low ED contragradience (the flat part of the signal in the 2D-fingerprint), making the score [2] more sensitive to the interaction situation. The score [3] is similar to [2] but extracts and quantifies strong (covalent) interactions in a given 2D-plot signature. Note that here, no strong interactions are detected between the ligand and the protein (no covalent bond between ligand and protein). Of course, the integration of the IGM-δg descriptor cannot be expected to lead as accurate results as QM calculations or IQA, but it offers a fast and robust way to get an order of magnitude of interactions comparing different systems or during their evolution along a reaction.
Note the energy of interaction estimated by IGMPlot in the igm.log output: -4.561e+01 kcal/mol. It is a large value since many interactions occur between the ligand and the protein. However, note that for now IGMPlot provides a crude estimate of this interaction energy in kcal/mol. Much must be done now to extend this estimation to other types of atoms, and in particular by extending the calibration range limited to 40 kcal.mol-1 in the present version, and by leveraging AI algorithms. Thus, until now, integration scores are more relevant to compare interactions between different situations.
3D-isosurfaces
We are now going to examine the regions of space where interactions take place between the ligand and the protein by using the script igm.vmd, which was automatically built by IGMPlot durint the IGMPlot calculation.The igm.vmd file file must be located in the folder containing the cube files while running VMD. Run VMD and load the igm.vmd session file (menu File/load Visualization state). Two windows appear: the VMD main window and the molecular viewer.
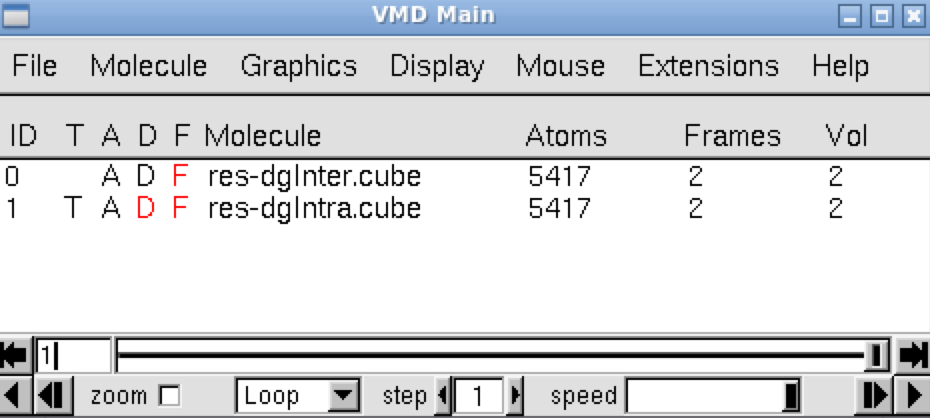
In the VMD main panel appear two “Molecules” lines (res-dgInter.cube and res-dgIntra.cube). Default of the script igm.vmd is to display the interactions between fragments: resdgInter.cube Molecule (button D is activated). Here, default is then to display the interactions between the ligand and the protein. But, the too many atoms (5417) of the protein prevent a clear interpretation of interactions.
The molecular system appears in the molecular viewer in “ball & sticks” representation. Press “S” to scale the picture, “T” to translate or “R” to rotate.
Follow the step-by-step instructions to improve the graphical representation in the molecular viewer:
- In the menu Graphics/Representations, in the scrolling menu “Selected Molecule”, select 0-res-dgInter.cube, select the CPK representation (by clicking on it) and replace the CPK Drawing method (menu Drawing method) by the Lines Drawing method in the panel below. This will lighten the protein representation.
- Select the Isosurface representation (by clicking on it) and adjust the isovalue to 0.01 (in the Isovalue field). This will highlight the regions of interactions.
- In the menu File/New Molecule/Browse, import the file lig.pdb by selecting 'lig.pdb' in the list and click on load. This is to give, later on, a different representation for the ligand and for the protein.
- In the menu File/New Molecule/Browse, import the file prot.pdb and click on load. This is to be able to generate a NewCarton representation for the protein (the pdb enables such a cartoon backbon representation).
- In the menu Graphics/Representations, in the "selected Molecule" scrolling menu select the Molecule 2-lig.pdb and replace the Lines Drawing method by a Licorice Drawing method (tab Draw Style/Menu DrawingMethod: select Licorice). This is to highlight the ligand.
- In the menu Graphics/Representations select the Molecule 3-prot.pdb and replace the Lines representations by a New Cartoon representation (tab Draw Style/Menu DrawingMethod: select NewCartoon). This is to put the emphasis on the secondary structure.
- For this same 3-prot.pdb molecule, create an additional representation by pressing the CreateRep button, then set the selection (in the field "Selected Atoms") to: resname MG ZN, and change the associated drawing method to VDW. This is to highlight the position of the two metallic centers.
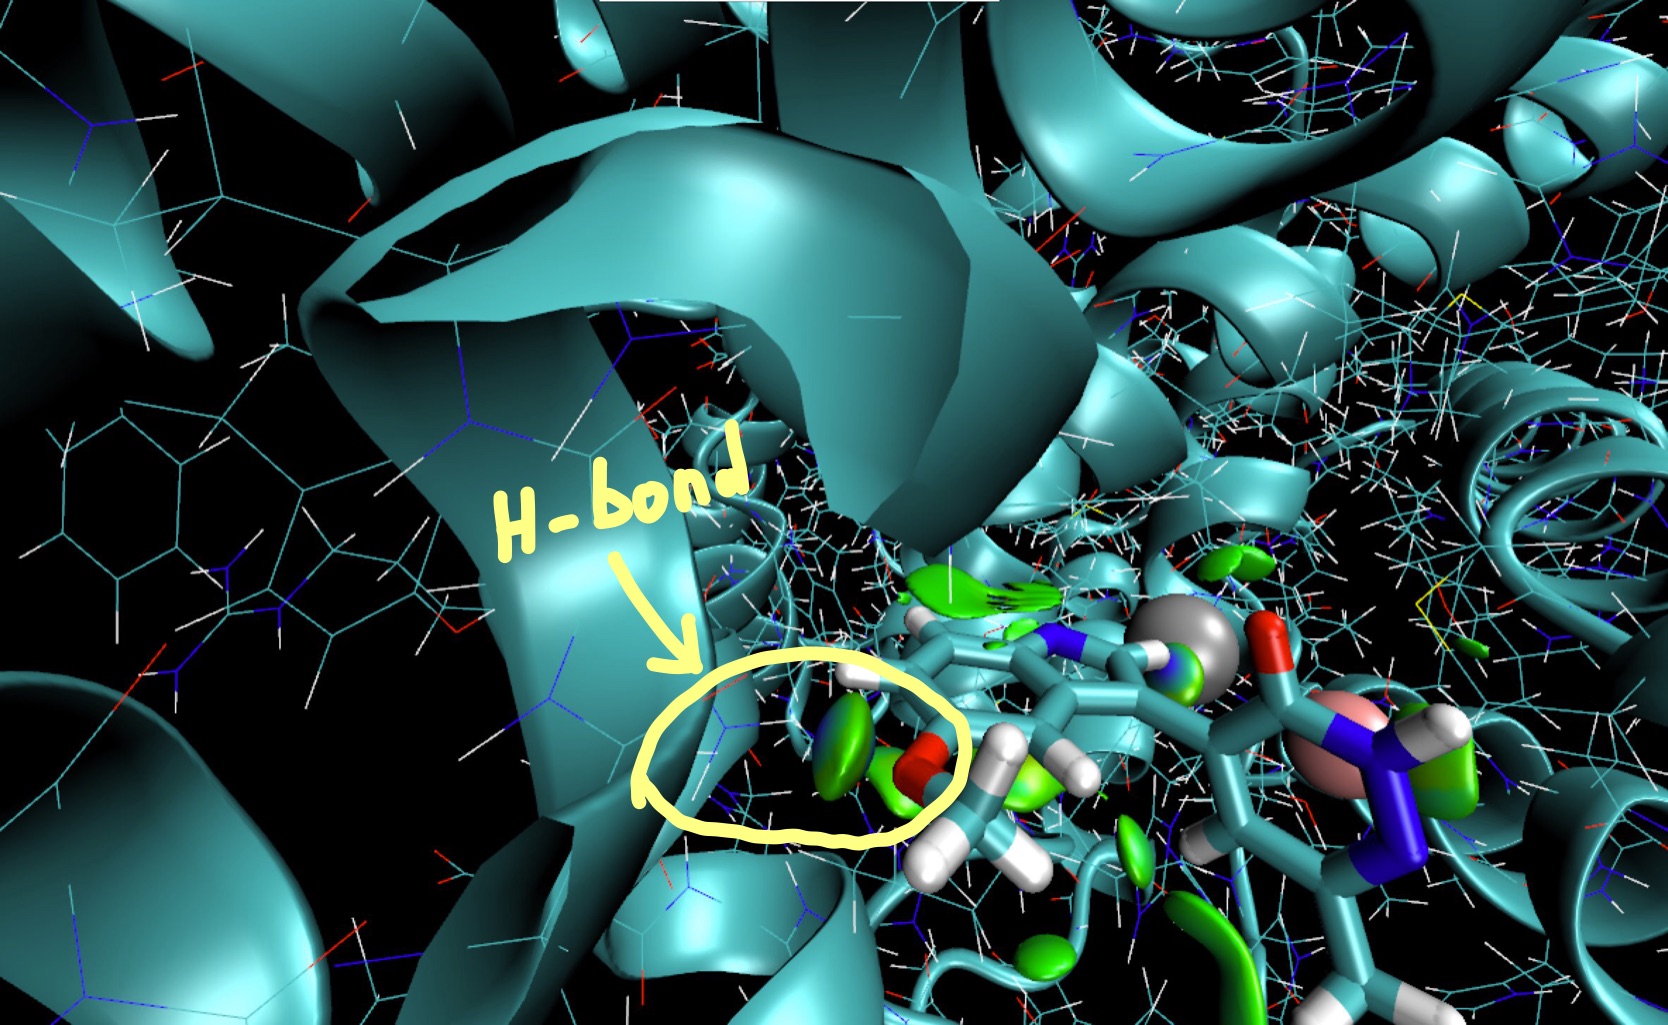
Since δg captures ED clash between different sources (atoms, fragments, molecules) such δg isosurfaces give rise to a coherent picture with stabilizing interactions accumulated in the center of several envelopes.
Note: the default δg isovalue = 40% of the maximum peak height found by IGMPlot in the 2D-finger-print. Changing the iso-value will change the size of the isosurfaces. To do that, go to the menu Graphics/Representations, select the 0:res-dgInter.cube molecule in the "Selected Molecule" menu. Then, select the “Isosurface” representation (by clicking on it) and change the “Isovalue” number in the panel (for instance set it to 0.005), to gradually grow or diminish the volume enclosed in the envelops. The larger the isovalue, the larger the ED interaction.
Zoom in and identify (visualize) the protein residue involved in an Hydrogen-bond with one of the two oxygens of the ligand. It is a glutamine residue. We will focus on this hydrogen in the next section. Press “1” and click on the hydrogen atom of this residue making a hydrogen-bond with the oxygen atom of the ligand in order to obtain its cartesian coordinates in the VMD text console. You should obtain: X = -25.759 Y = 0.8030 Z = -13.2260.
Save this vmd session: menu File/Save Visualization State and provide the name visu.vmd in the FileName field.
b) Focusing on one hydrogen-bond
Exit VMD and change to the directory ../2_focusHBondUse the RADIUS keyword in the param.igm input file to set the grid centered around the hydrogen previously identified with a radius of 2 Angströms. Edit and save the following param.igm input file:
2
lig.xyz
prot.xyz
INCREMENTS 0.2 0.2 0.2
RADIUS -25.759001 0.803000 -13.226000 2.0
-> IGMPLOT param.igm > igm.log &
As you may notice, the CPU times of this execution is much lower than previously. This is because the grid is much smaller! (focused on a given atom and its nearby surroundings).
Reading igm.log
Edit the new igm.log output file and look at the INTEr section.Note the interaction energy estimated by IGMPlot for the studied hydrogen-bond (in igm.log): -5.538e+00 kcal/mol. This is much lower than the total interaction energy, since we have focused here on the hydrogen-bond involving only one single residue of the protein.
3D-isosurfaces
We are going now to examine the region of space where this hydrogen-bond takes place. Instead of repeating from scratch the step-by-step above procedure to improve the graphical representation in VMD, we are going to re-use the previously saved visu.vmd script. However, since it was generated by IGMPlot with PATH pointing to 1_allInter, this script has to be adjusted with the current PATH: 2_focusHBond.In order to save much time, copy the visu.vmd session file previously generated and edit it to manually change every pattern 1_allInter by 2_focusHBond. Or still better, execute the command line :
sed 's/1_allInter/2_focusHBond/g' ../1_allInter/visu.vmd > visu.vmd
Next, run VMD and load this script visu.vmd (menu File/load Visualization state). The isosurface which appears has a disc-shape, it is not flat as for van der Waals interactions observed in the previous section.
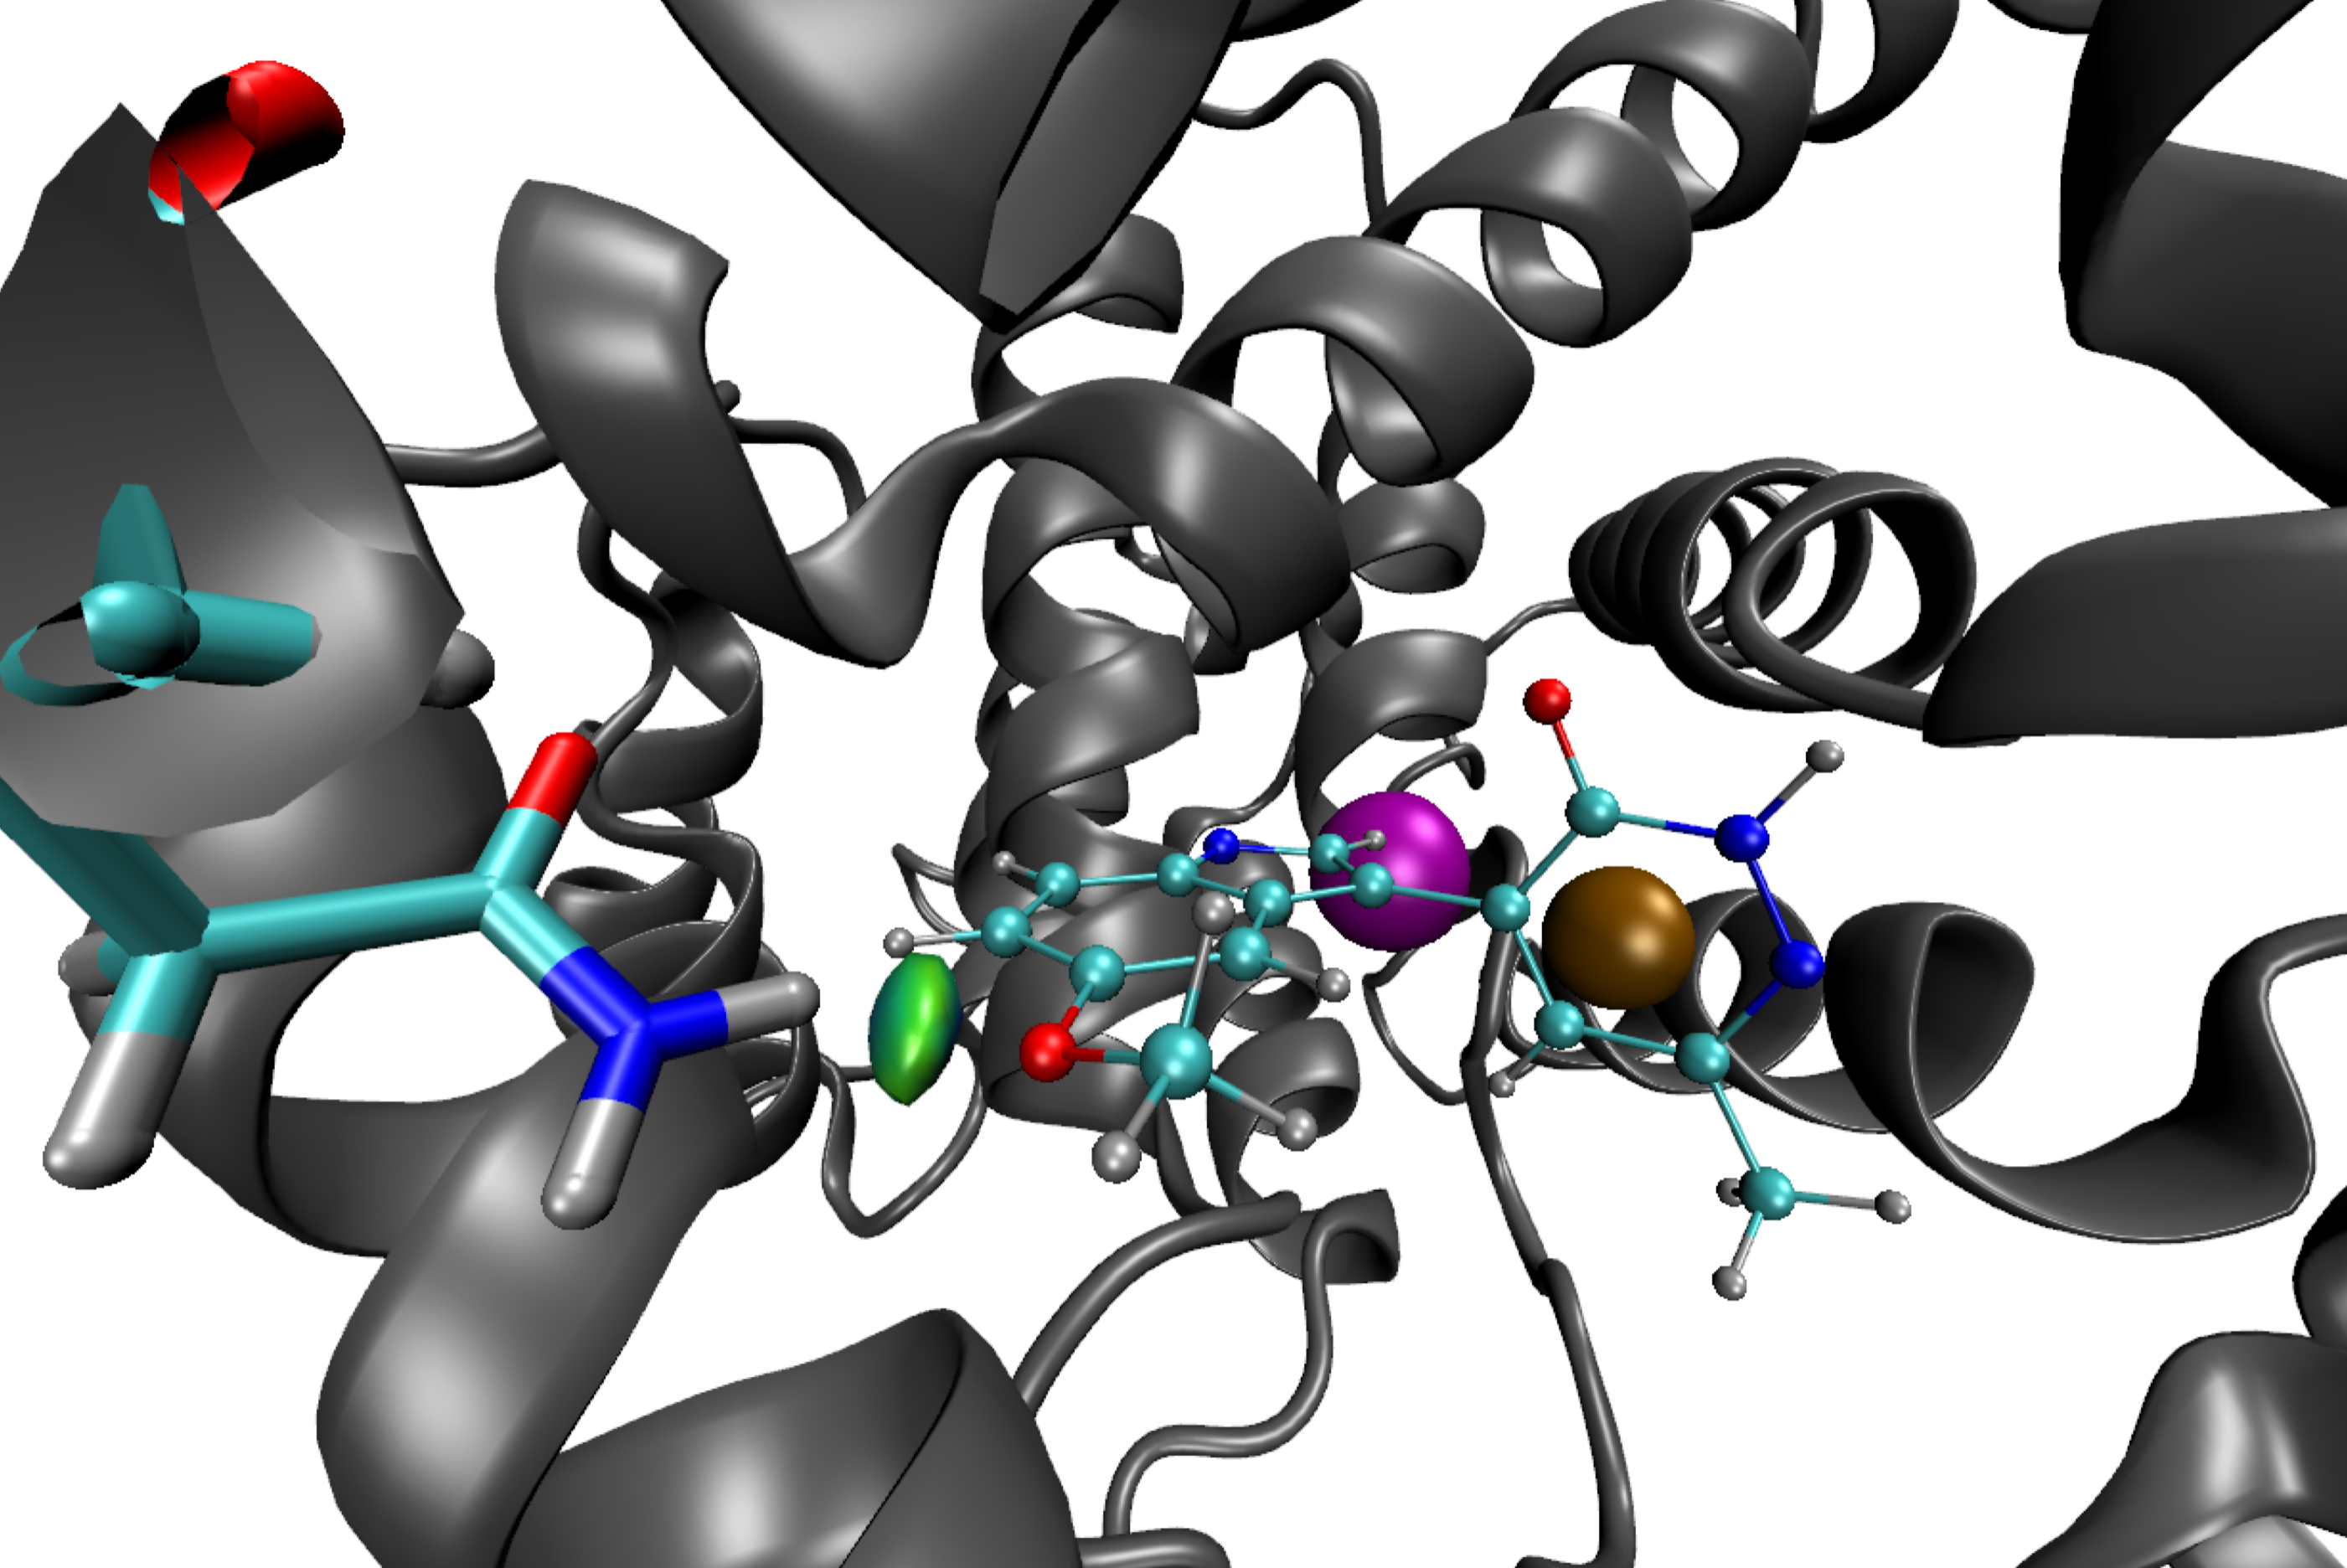
To still improve and lighten the graphical representation in the molecular VMD viewer, follow the step by step procedure:
- Go to the menu Graphics/Representation, and select the 0:res-dgInter "Molecule" in the "Selected Molecule" scrolling menu.
- Double-click on the "Lines" representation to disable it.
- select now the 3:prot.pdb "Molecule" in the "Selected Molecule" scrolling menu.
- add a new representation by clicking on Create Rep button
- set the Selected Atoms field to: resid 535
- set the Drawing method to CPK or Licorice (up to you)