back to summary
-
You can access the necessary files for this tutorial by downloading this
archive. Once downloaded, place it in a convenient location and extract its contents:
[user]$ tar -xvjf 5_IBSI.tbz2
Unpacking the archive will create a directory called 5_IBSI/, wherein this tutorial will be conducted. - The results of the calculations can be found in this archive_results.
V. Bond strength and Pair Density Asymmetry
Go to directory 5_IBSI/1_react/The IBSI (Intrinsic Bond Strength Index) score provides a quantitative bridge between the local electron density-based descriptor δg and the physically grounded bond strength concept.
In this example, we are going to probe the strength of a C-Cl bond and the influence of a Lewis acid on the strength of this bond.
1) Probing bond strength: the IBSI index
If you have a look at this system, you will see that it corresponds to the starting point of the (symmetrical) SN2 reaction between CH3Cl and Cl-.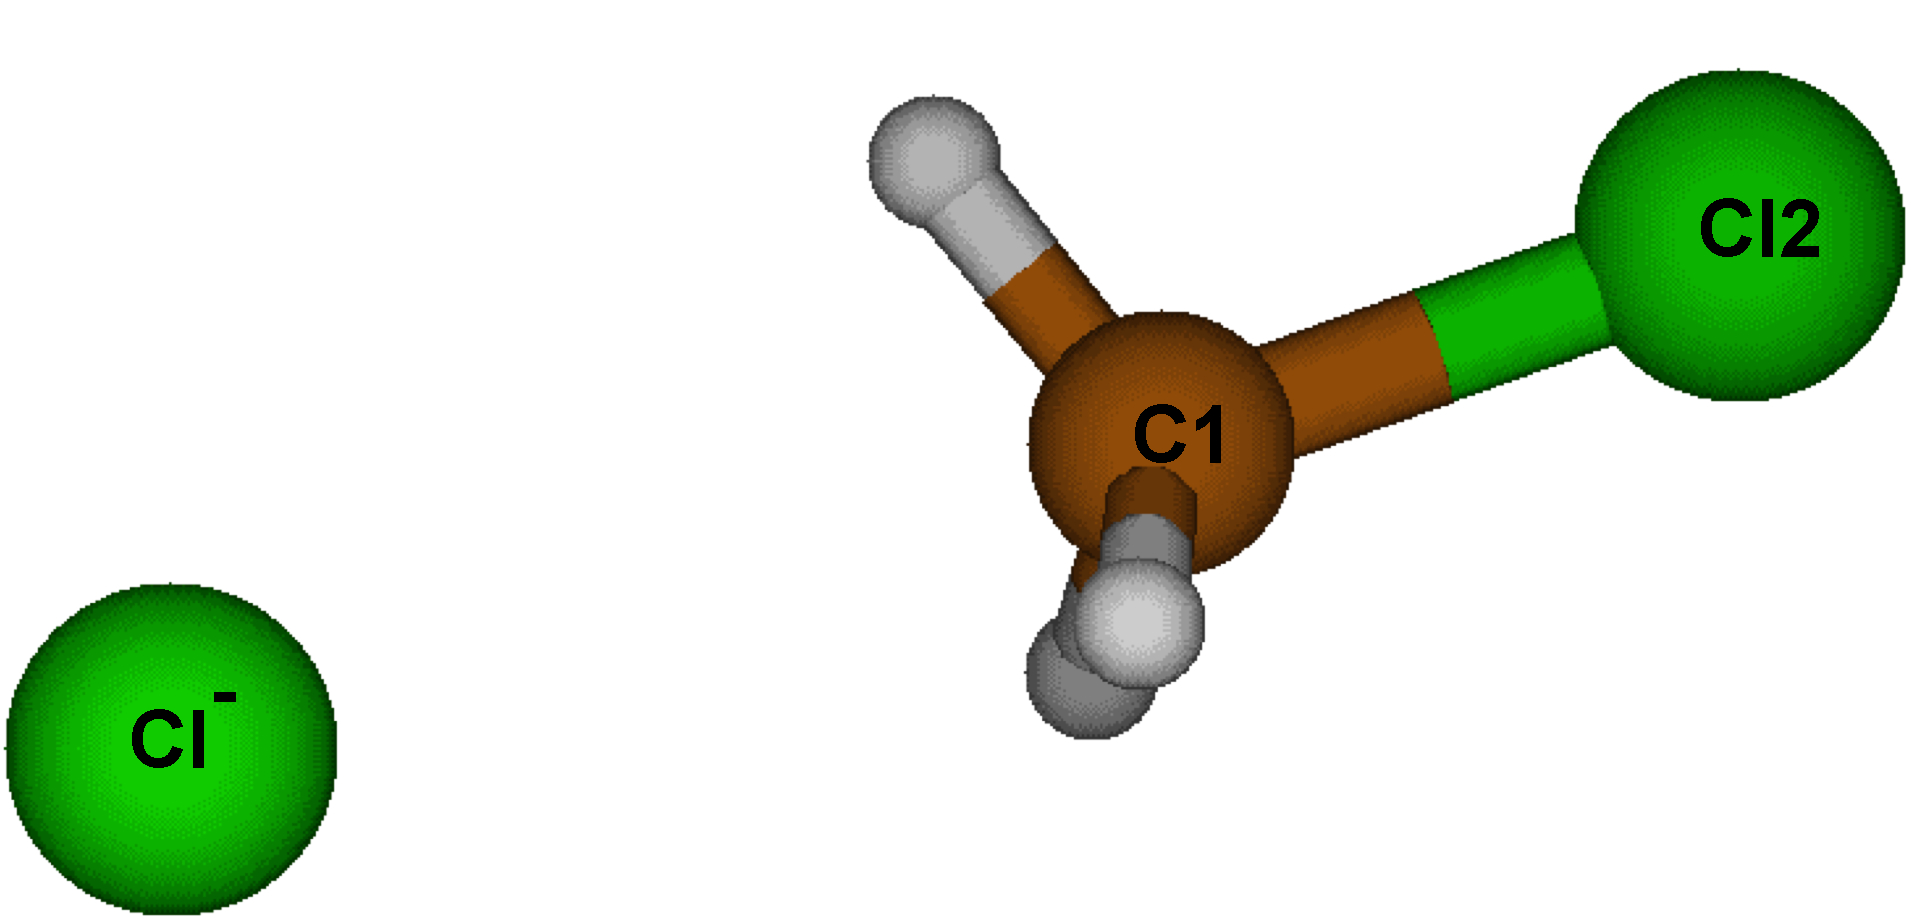
Edit and save the following param.igm input file:
1
mol.wfx
IBSI
1 2
ENDIBSI
- 1: one single input is expected
- mol.wfx: the name of this input file, describing the wave function of this system
- IBSI/ENDIBSI: keyword to start/end the IBSI section
- 1 2: bond strength between atoms 1 and 2 is requested
In a linux terminal run the IGM analysis from the supplied wfx wave-function input file:
--> IGMPLOT param.igm > igm.log &
Note that here, only the igm.log outputfile is generated. Actually, since a cylindrical grid is employed to perform the IBSI calculation, no “cube” file can be generated to draw δg isosurfaces (VMD only makes use of “rectangular” grids).
Analysis of igm.log
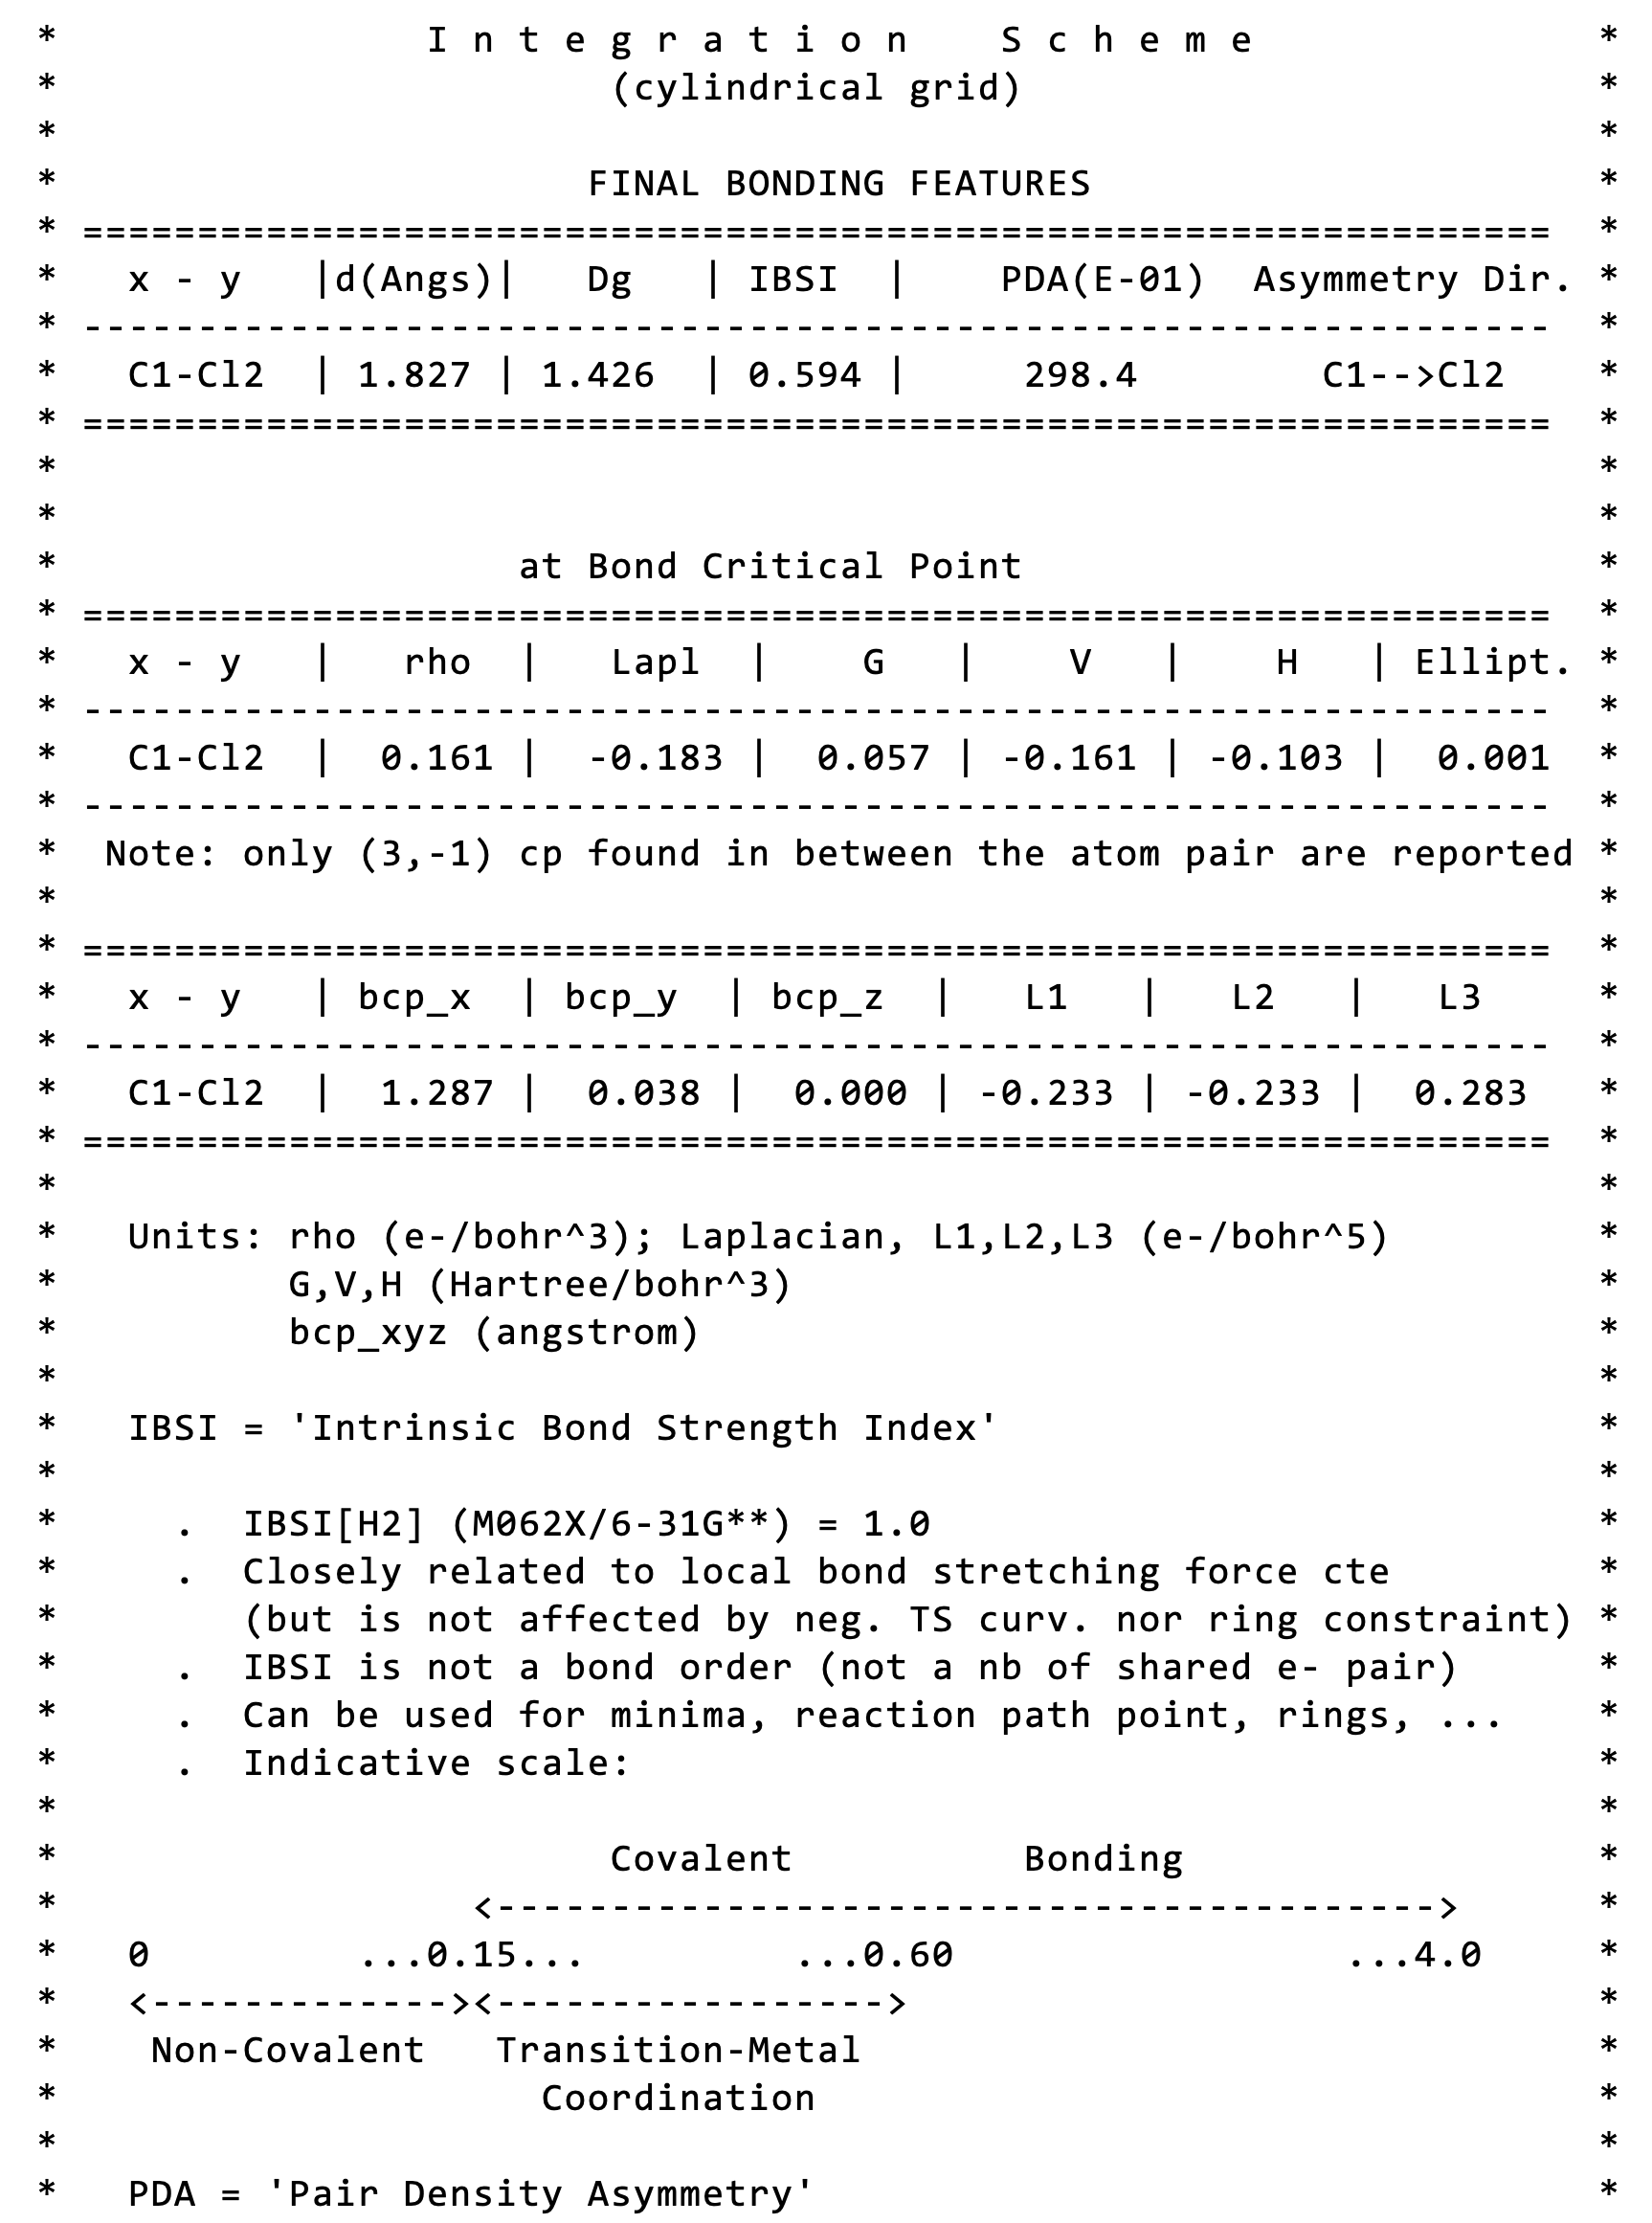
The main results is: IBSI = 0.594 (dimensionless). It is obtained from the integrated score Dg (1.426). IBSI is normalized to 1 for H2. To give an idea, the strength of a single C-C bond is about IBSI = 0.8. Thus, the Cl-C bond has a relatively low bond strength here, according to the IBSI indicative scale:
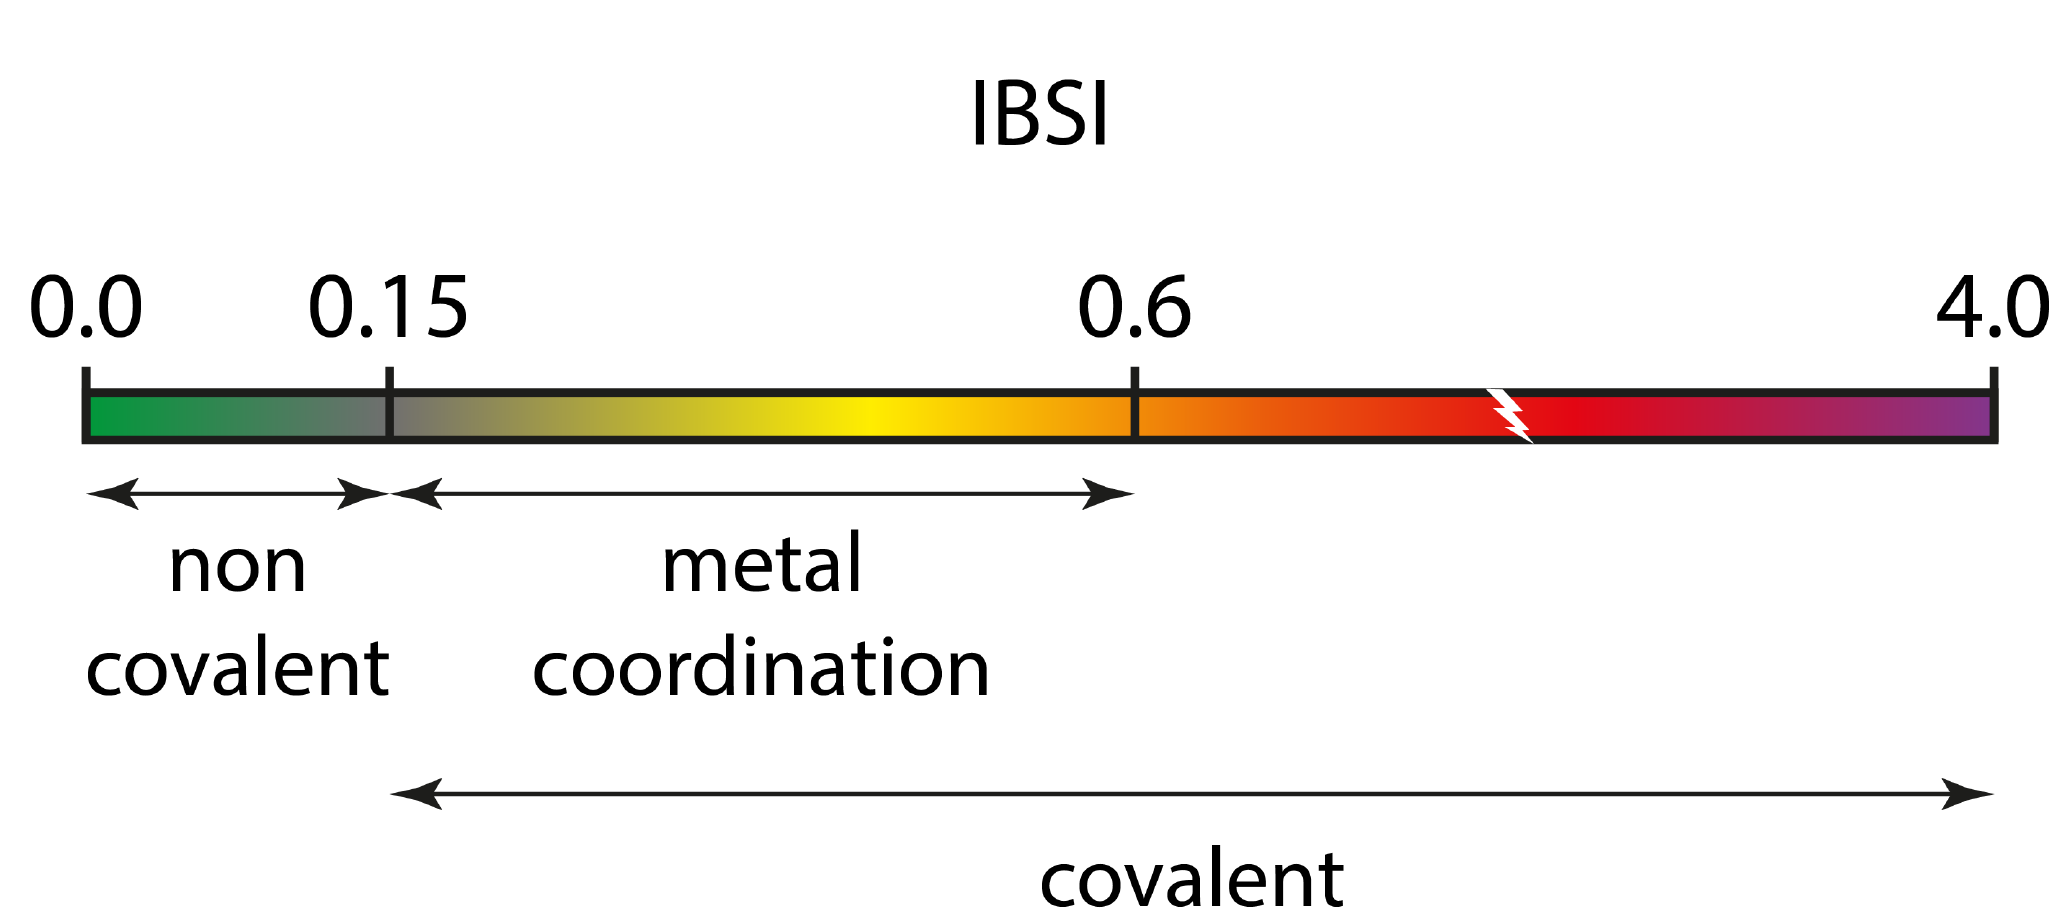
Our study has shown that the IBSI is not a bond order (like Mulliken, Wiberg, Mayer, delocalization index or ELF). it does not represent a number of electron pair shared between two atoms. Thus, the values of IBSI should absolutely not be compared to those of bond orders. Rather, it is a new complementary index, related to the bond strength. The IGM-IBSI procedure has been extensively tested with a wide range of molecules and IBSI has been shown to have a very strong correlation with the local stretching force constant. This represents an important advancement in bond strength analysis. A key benefit of this approach is that it provides a bond strength value that is specific (intrinsic) to the considered atom pair, unlike traditional harmonic vibrational analysis which yields force constants that are spread over multiple atoms. Also, the conventional force constant k is no longer attached to the restoring force concept in transition state situation, and yet atoms continue to share electrons. In contrast, the IBSI index is still attached to the notion of bond strength in that case. Thus, IBSI allows us for internally probing bond strength in TS structures and along reaction pathways for breaking and forming bonds. IBSI covers a broad range of bonding situations. An indicative scale is provided, which was obtained from a set of 677 bonds of 235 molecules in their ground state. But IBSI can also serve to assess bond strength in excited states.
♥ The IBSI calculation uses an ultrafine cylindrical grid. To save time, you can specify a cutoff radius in the IBSI calculation by giving the radius (in angströms) after the IBSI keyword:
1
mol.wfx
IBSI 3.5
1 2
ENDIBSI
2) Probing bond asymmetry: the PDA index
The Pair Density Asymmetry is given together with the IBSI value. Here, a value of 29.8 is found for C-Cl, directed towards the chlorine atom. This index has been initially devised to assess inductive effects on specific bonds in molecules.In a homonuclear diatomic molecule, in the absence of external perturbation, electrons are equally distributed between the two atoms leading to a symmetrical picture of the electron density (ED) along the bond. In contrast, when different atoms bond together the ED is accumulated unequally between atoms. The PDA index gives a measure of the ED asymmetry in between the two atoms and the direction of the asymmetry. The PDA index takes the asymmetry information from the electron density gradient calculated in between the two atoms.
The direction of asymmetry as measured by the PDA points towards the atom bringing the most electrons in the bond axis (z) direction (the internuclear axis). But, take care, a bond involving two atoms of different periods will display a much greater asymmetry than two different atoms belonging to the same period. For instance, the PDA value of C−H bond in CH4 (22.9) is much larger than the PDA of C–F (10.6). This makes sense since in CH4, the 1s atomic core orbital of C brings large electron density gradient in the bond axis direction (among others) while H has no core counterpart.
The PDA is sensitive to the chemical surroundings of the atom pair. That is the whole point of the PDA tool: to examine and quantify the effect of external factors on a given bond. For instance, the PDA tool can serve to measure the electronic effect caused by one, two or three fluorine atoms on the adjacent C–C bond of ethane initially purely symmetrical. We are going to assess below the effect of a Lewis acid on the strength of the C-Cl bond in the reactant material.
The PDA has nothing to do with the bond polarity derived from a conventional point charge analysis. Actually, the latter is not based on the ED gradient (but on the ED and nuclear charges) and it incorporates, to some extents, the ED distribution features of all neighbors beyond the examined atom pair, while the PDA analysis is exclusively restricted to the region in between the examined atom pair and is tackled directly at the electron density gradient level.
3) Probing electronic effects on bond strength
Go to directory ../2_react_LA/Here, we are going to examine the effect of LiH (considered here as a Lewis acid) acting on the strength of C-Cl.
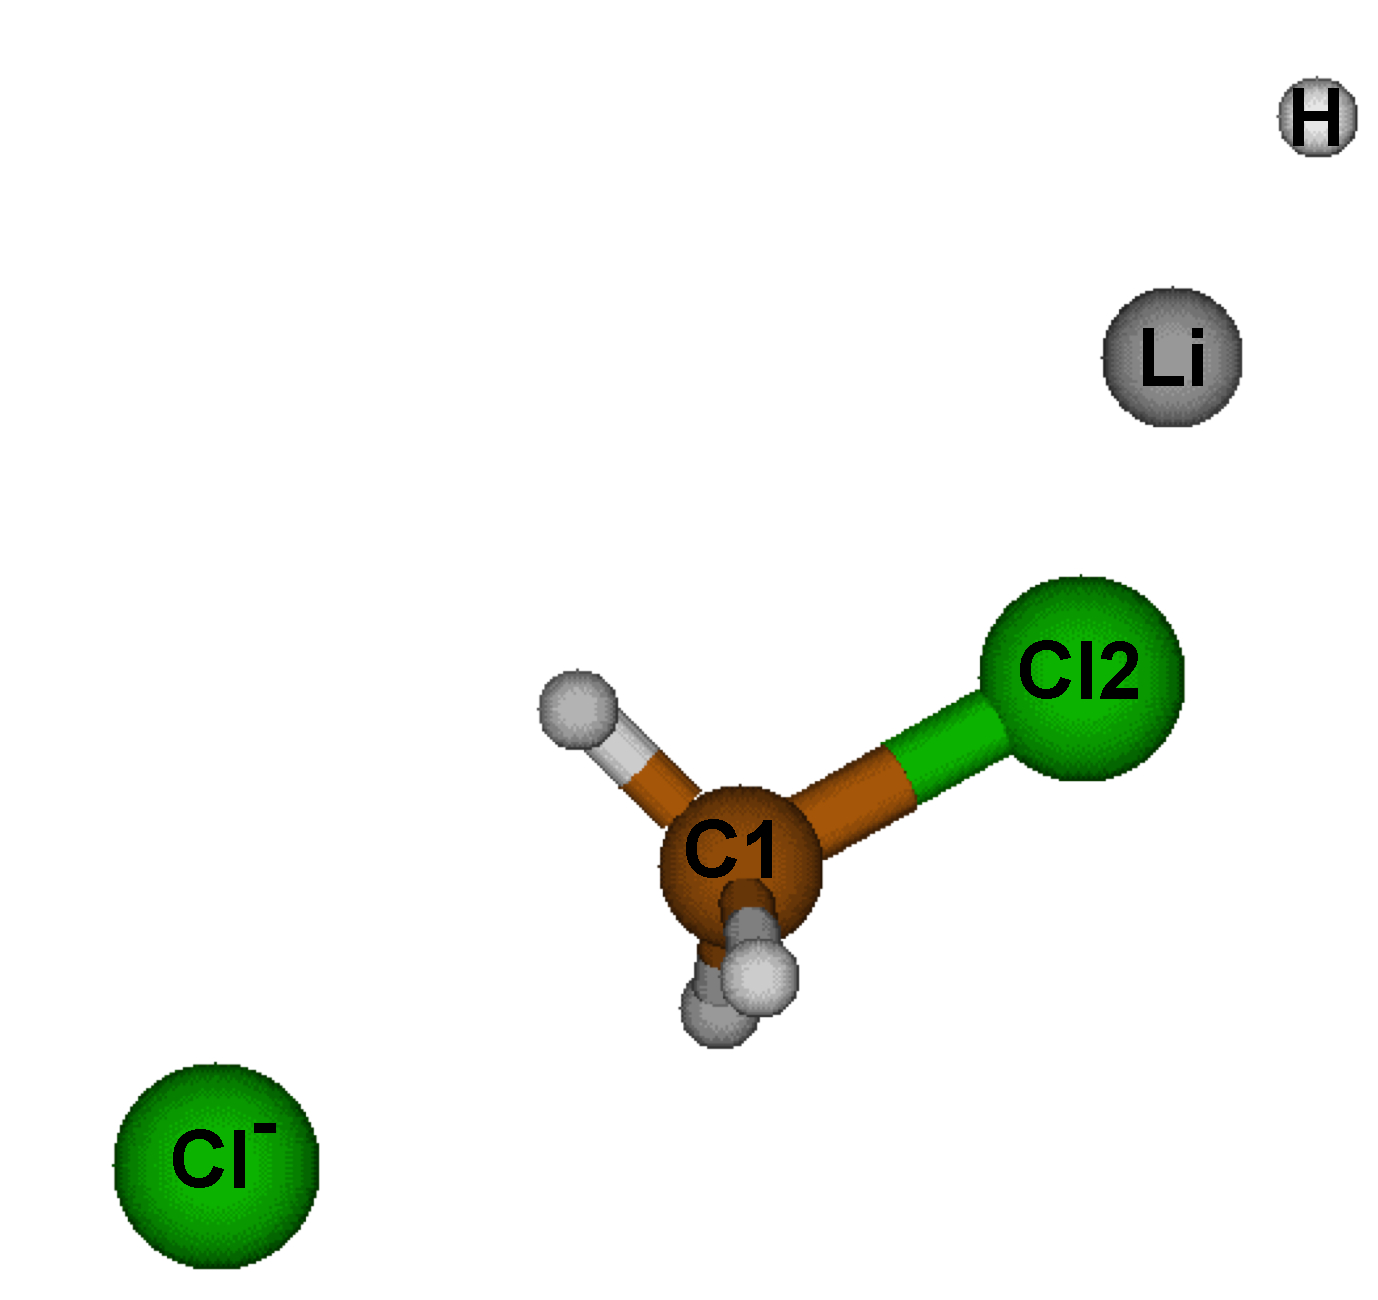
Edit and save the following param.igm input file:
1
mol.wfx
IBSI
1 2
2 7
1 3
1 6
ENDIBSI
- 1 2 : C-Cl
- 2 7 : Cl...Li
- 1 3 : C-H
- 1 6 : Cl...C
--> IGMPLOT param.igm > igm.log &
As can be seen from the resulting igm.log output file, the new IBSI value for the same C-Cl bond is now: 0.514, significantly lower than the previous one (0.594). In that case, the presence of the Lewis acid weakens the C-Cl to be broken in the SN2 reaction while the C-Cl pair density asymmetry remains almost unchanged (28.9 instead of 29.8 without assistance). Also, one can observe a very low bond strength for the Li...Cl atom pair (0.063). According to the IGM IBSI scale, IGMPlot classifies this interaction as a non-covalent interaction. Yet, the lithium atom has a large electronic effect on the bond strength of the adjacent C-Cl bond to be broken in the SN2, as measured by IBSI.
In other respects, one can observe that the C-H bond features a greater bond strength (0.879). Finally, one can see that the forming Cl-...C bond is very very weak (IBSI = 0.033) at the starting point of the reaction.
4) How to get the 3D-isosurface for an atom pair.
Go to directory ../3_react_LA_3D/Since a cylindrical grid was employed to perform the IBSI calculation, no “cube” file is generated to draw δg isosurfaces (VMD only makes use of “rectangular” grids).
♥ To get "bond" δg isosurface re-run the calculation by specifiying FRAG1 and FRAG2 selections in the param.igm input file, without specifying the IBSI keyword, for instance:
1
mol.wfx
FRAG1 1;
FRAG2 2;
Here, FRAG1 and FRAG2 points to only one single atom, 1 and 2, respectively. This way, only the interaction between atoms 1 and 2 is examined. IGMPlot will generate cube files that can be used to construct isosurfaces that can be visualized using the VMD program.
In a linux terminal run the IGM analysis:
--> IGMPLOT param.igm > igm.log &
That way, cube files will be generated as well as associated vmd scripts.
3D-isosurfaces
We are going now to use the igm.vmd file generated by IGMPlot to generate δg isosurface associated with the bond between atoms 1 and 2. This igm.vmd script must be located in the folder containing the cube files while running VMD. Run VMD and load the igm.vmd session file (menu File/load Visualization state). Two windows appear: the VMD main window and the molecular viewer.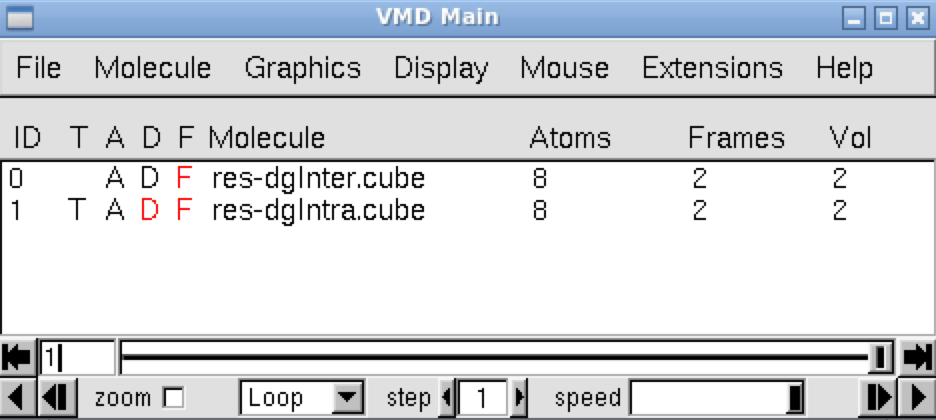
In the VMD main panel appear two “Molecules” lines (res-dgInter.cube and res-dgIntra.cube). Default of the script igm.vmd is to display the interactions between fragments: resdgInter.cube Molecule (button D is activated). Here, default is then to display the interaction between atoms 1 and 2.
The molecular system appears in the molecular viewer in “ball & sticks” representation. Press “S” to scale the picture, “T” to translate or “R” to rotate.
The resulting δg_inter isosurface clearly reveals the C-Cl bond.
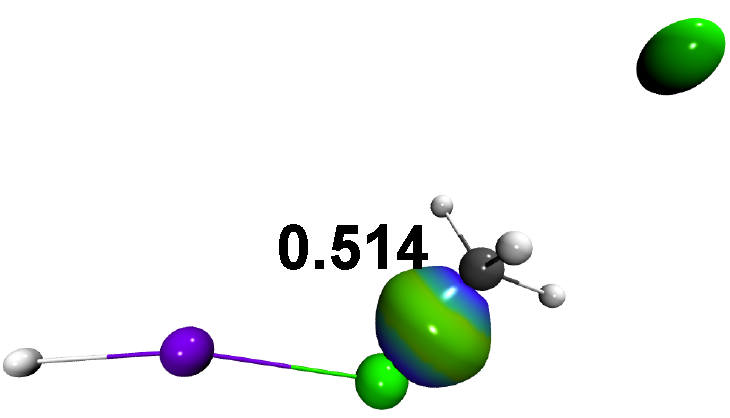
If you want to display the resdgIntra.cube representation Double-click on the “D” letter of res-dgInter.cube Molecule in the VMD main panel to hide it and Double-click on the “D” letter of resdgIntra.cube Molecule to enable it. However, in our case, no interaction is present in the “Intra” cube since each fragment is made of only one single atom.
Since δg captures ED clash between different sources (atoms, fragments, molecules) such δg_inter isosurfaces give rise to a coherent picture with stabilizing interactions accumulated in the center of the envelope.
- go to the menu Graphics/Representations, select 0:res-dgInter.cube in the "Selected Molecule" scrolling menu
- select the tab "Trajectory"
- set the lowerlimit and upperlimit of the Color Scale Data Range to -0.3 and 0.3, respectively.
Note: the default δg isovalue = 40% of the maximum peak height found by IGMPlot in the 2D-finger-print. Changing the iso-value will change the size of the isosurfaces. To do that, go to the menu Graphics/Representations, select the “Isosurface” representation (by clicking on it) and change the “Isovalue” number in the panel, to gradually grow or diminish the volume enclosed in the envelops. The larger the isovalue, the larger the ED interaction.