back to summary
-
You can access the necessary files for this tutorial by downloading this
archive. Once downloaded, place it in a convenient location and extract its contents:
[user]$ tar -xvjf 3_trinuclearCopCx.tbz2
Unpacking the archive will create a directory called 3_trinuclearCopCx/, wherein this tutorial will be conducted. - The results of the calculations can be found in this archive_results.
III. Copper complex
Go to directory 3_trinuclearCopCx/1) Atomic contributions to the intermolecular interactions
In both modes: PROMOL and QM, when two interacting fragments are defined, a compelling feature of the IGMPlot program is to carry out automatically an atomic decomposition scheme in order to estimate the influence of each atom in the intermolecular interaction region between two user-selected fragments.We are going to examine the interactions between a copper complex and the fullerene molecule.
Edit and save the following param.igm input file:
2
frag1.xyz
frag2.xyz
- 2 --> two files describing the two fragments in interaction
- frag1.xyz --> the name of the first file
- frag2.xyz --> the name of the second file
Note that since cartesian xyz input files are supplied to IGMPLot; the program will automatically implement a promolecular model to get the electron density (ED).
Provided that you have installed IGMPlot (see documentation for installation instructions), run the program with the command in a linux terminal: --> IGMPLOT param.igm > igm.log &
- IGMPLOT: the executable name of the IGMPlot program
- param.igm: the input file
- > igm.log: standard output will be redirected to file igm.log
- &: command is run in background
Have a look at the resulting output files list:
- AtContribInter.vmd: vmd script to display the atoms coloured according to their contribution to the intermolecular interaction
- mol-AtContribInter.dat: atomic contributions to the intermolecular interaction
- igm.log: text outputfile of the IGM execution
- igm.vmd: VMD script to automatically display δg 3D isosurfaces
- mol-dens.cube: cube file describing the electron density (ED) at each node of the grid
- mol-dgInter.cube: cube file describing the δg_inter value at each node of the grid
- mol-dgIntra.cube: cube file describing the δg_intra value at each node of the grid
- mol-igm.dat: file with data in columns to be used with GNUPLOT to generate 2D-fingerprints
- mol-nci.dat: file with data in columns to display the RDG=f(ED) 2D-plot
- mol-RDG.cube: cube file describing the Reduced Density Gradient value at each node of the grid
- nci.vmd: VMD script to automatically display RDG 3D isosurfaces
♥ Within the promolecular mode, when using two fragment input files, the IGM grid (encompassing the system) is built around fragment 1 with a 3 ansgtröms buffer arount it ==> it is better to set FRAG1 as the smallest system! It will save much CPU time.
♥ a “runinfo” information file is provided and updated (every 8s) during the run to let you know an estimate of the remaining time before the end of calculation.
2D-fingerprint
We are now going to analyse the interaction 2D-fingerprint. Edit the mol-igm.dat output file with a text editor and have a look. Six columns can be used to plot the δg-fingerprint:- Column 1: signed ED
- Column 2: RDG (for NCIplot representation)
- Column 3: δg-intra descriptor: quantifies the interactions inside each fragment
- Column 4: δg -inter: quantifies the interactions between the two fragments
- Column 5: qg-intra descriptor: the 'quotient' twin descriptor of δg-intra
- Column 6: qg-inter descriptor: the 'quotient' twin descriptor of δg-inter
Exit the file and use for instance GNUPLOT to get the δg fingerprint using columns 1 and 3 (for the δg intra signature) and using columns 1 and 4 (for the δg inter signature). Proceed with the generation of the intra and inter-fragment signatures using GNUPLOT:
plot "mol-igm.dat" u 1:3 title "intra" pt 7
plot "mol-igm.dat" u 1:4 title "inter" pt 7
The resulting interaction fingerprints are (δg intra on the left, δg inter on the right):
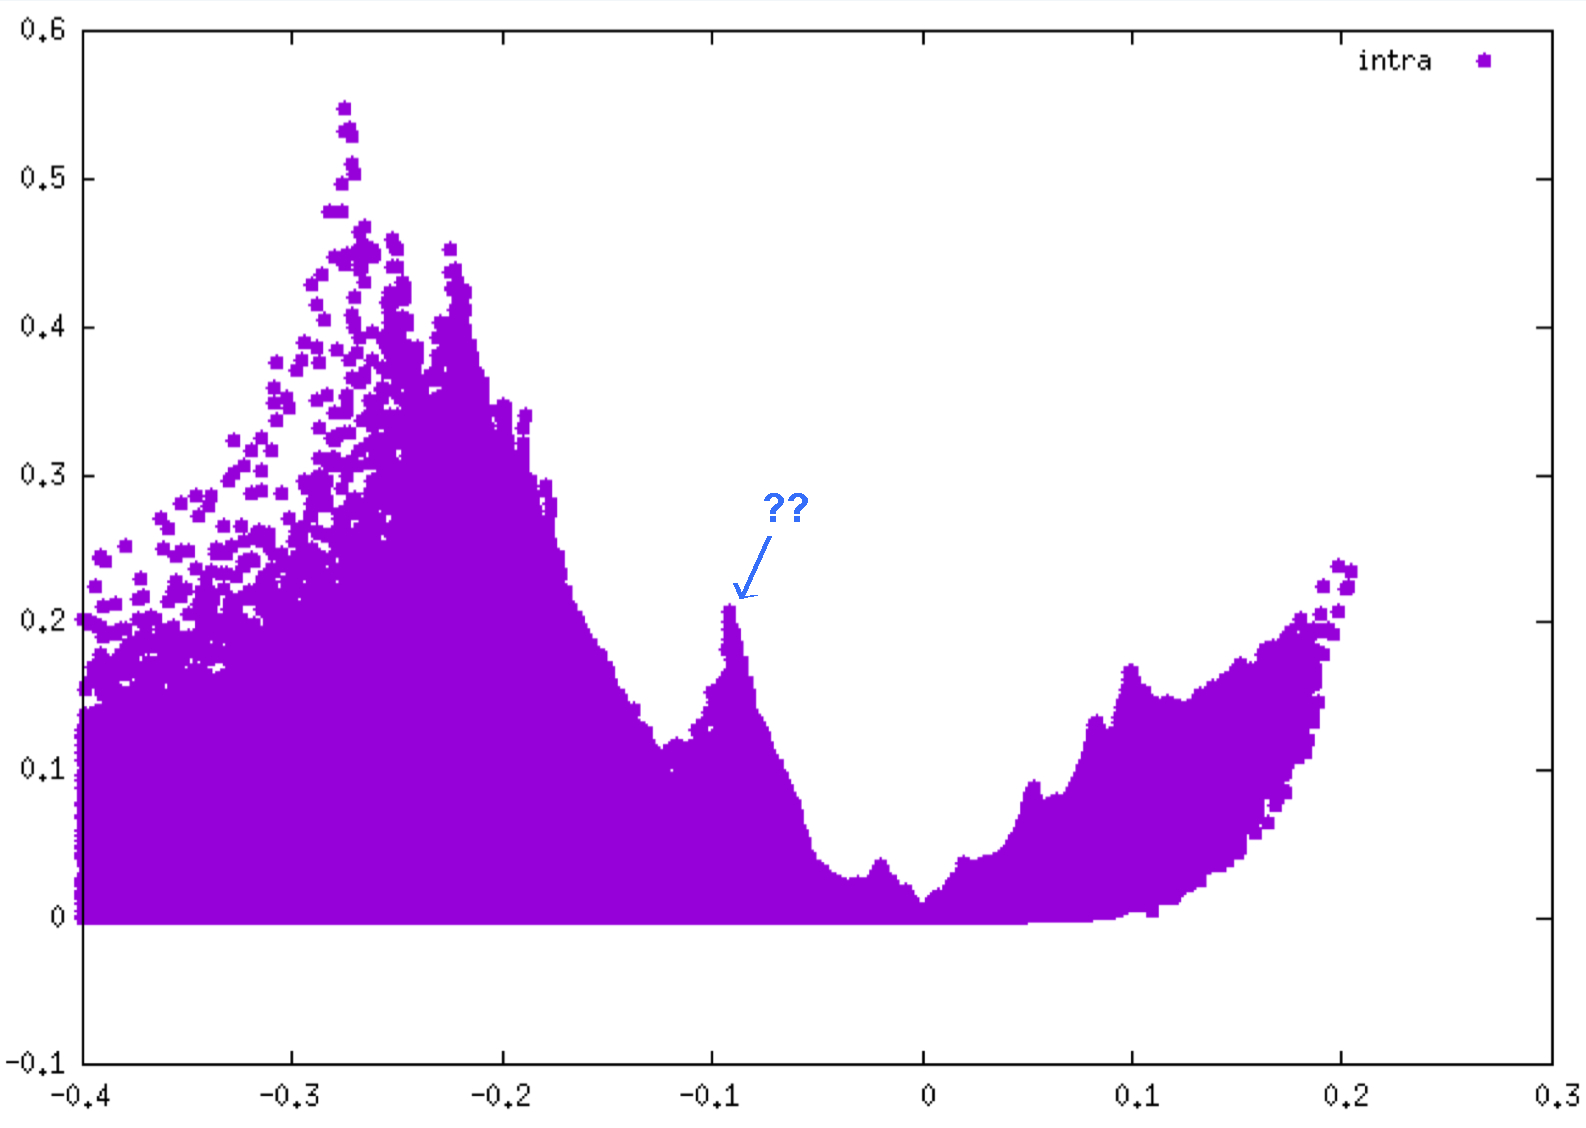
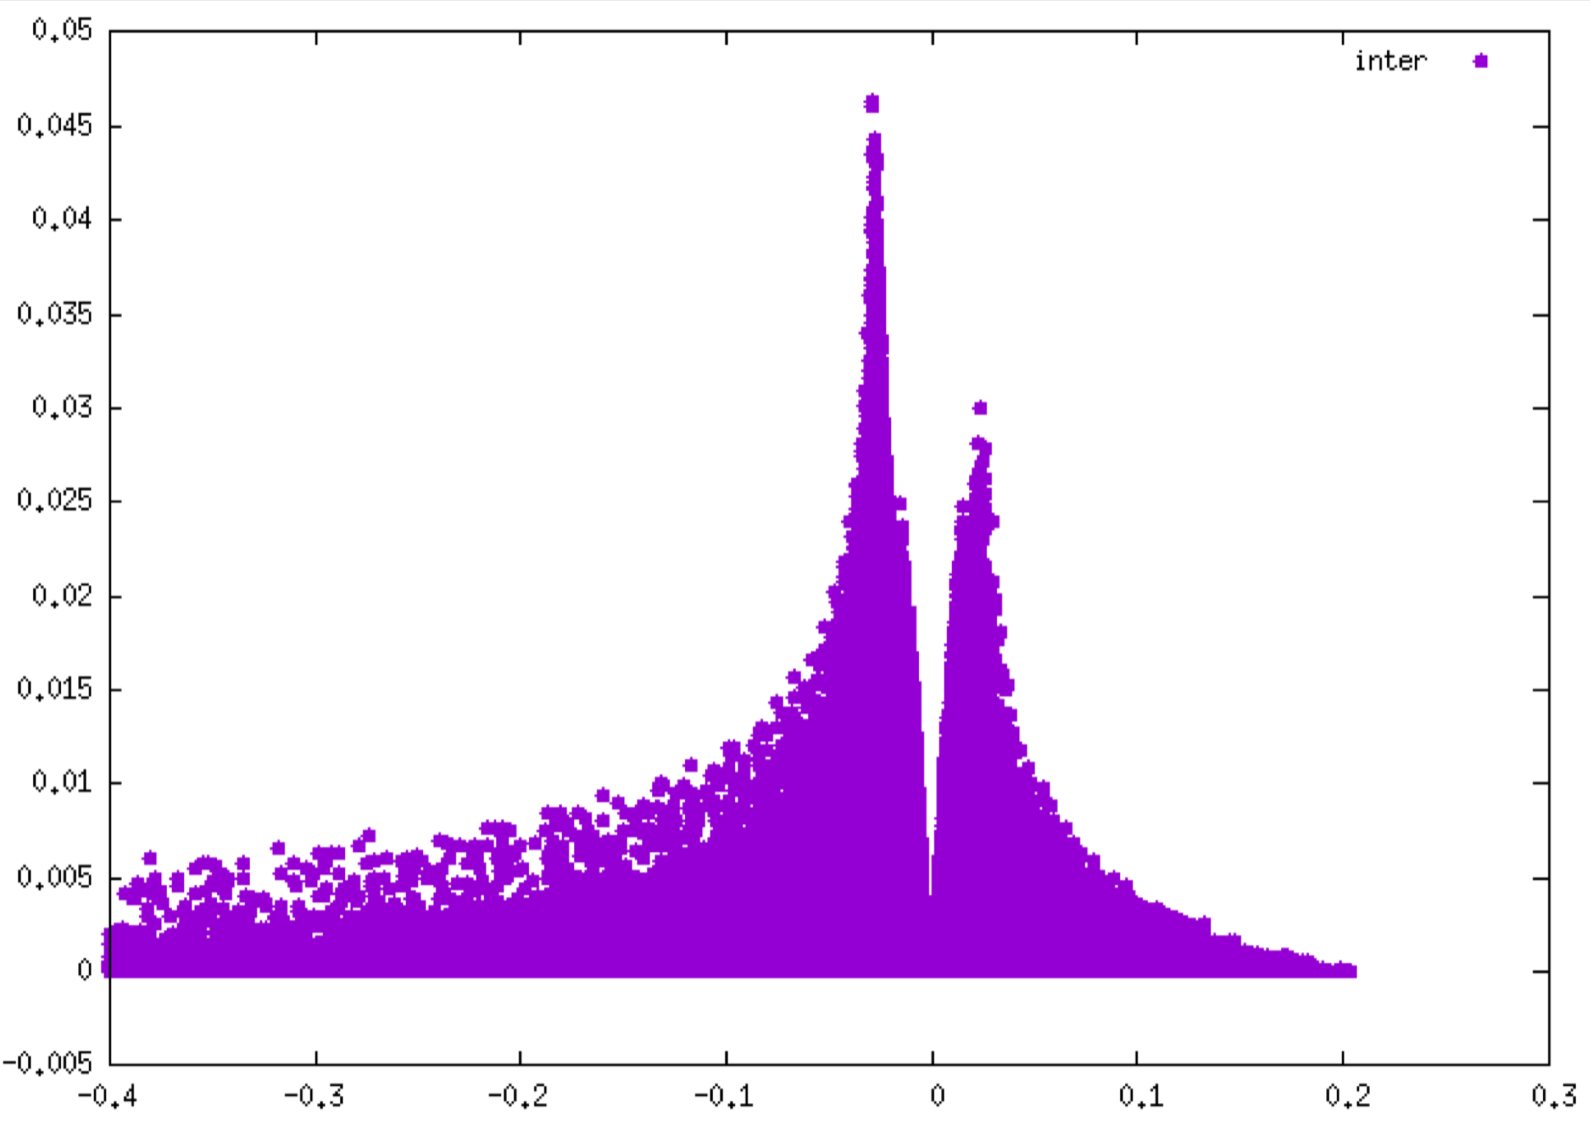
Remind that the negative side of each plot corresponds to interactions occuring in binding regions. One peak = one interaction. The larger the peak, the greater the interaction.
As you can see, the interaction detected between the two fragments is much smaller (peak height up to 0.045 a.u. on the right) than the interactions revealed inside each fragments (peak height up to 0.55 a.u. on the left).
The δg_intra 2D-fingerprint reveal many peaks corresponding to different covalent bonds present in each fragment (CC, CN, CF, ...). On the other hand, the δg_inter 2D-fingerprint seems to reveal only one small peak in the attractive part. In fact, if you zoom in the plot by the following GNUPLOT commands:
set xrange[-0.05:0.05]
plot "mol-igm.dat" u 1:4 title "inter" pt 7
you will see that the structure of the δg_inter 2D-fingerprint is more complex, and corresponds to non-covalent interactions between the fullerene and the copper complex.
Still better, you can use the qg twin descriptor to color the points of the plot according to the value of qg, for instance, for the δg_intra 2D-fingerprint, within the gnuplot environment, type:
set xlabel "sign({/Symbol l}_2){/Symbol r} (a.u.)" font "Helvetica,18" offset 0.0, 0.1
set ylabel "{/Symbol d}g (a.u.)" font "Helvetica,14" offset 0.2, 0.0
set palette rgbformulae 22,13,-31
set cbrange[1:4]
set xrange[-0.25:0.1]
set yrange[0:2]
plot "mol-igm.dat" u 1:3:5 every ::1 notitle pointtype 7 ps 0.8 palette
- set xlabel ... --> sets the x axis label
- set ylabel ... --> sets the y axis label
- set palette rgbformulae 22,13,-31 --> palette definition to color each point
- set cbrange[1:4] --> range of the qg color scale (1 <-> no interaction)
- every ::1 --> skips line 1 (the header of mol-igm.dat)
- u 1:3:5 --> using columns 1 (signed ED), 3 (δg_intra) and 5 (qg_intra)
- palette --> color according to column 5
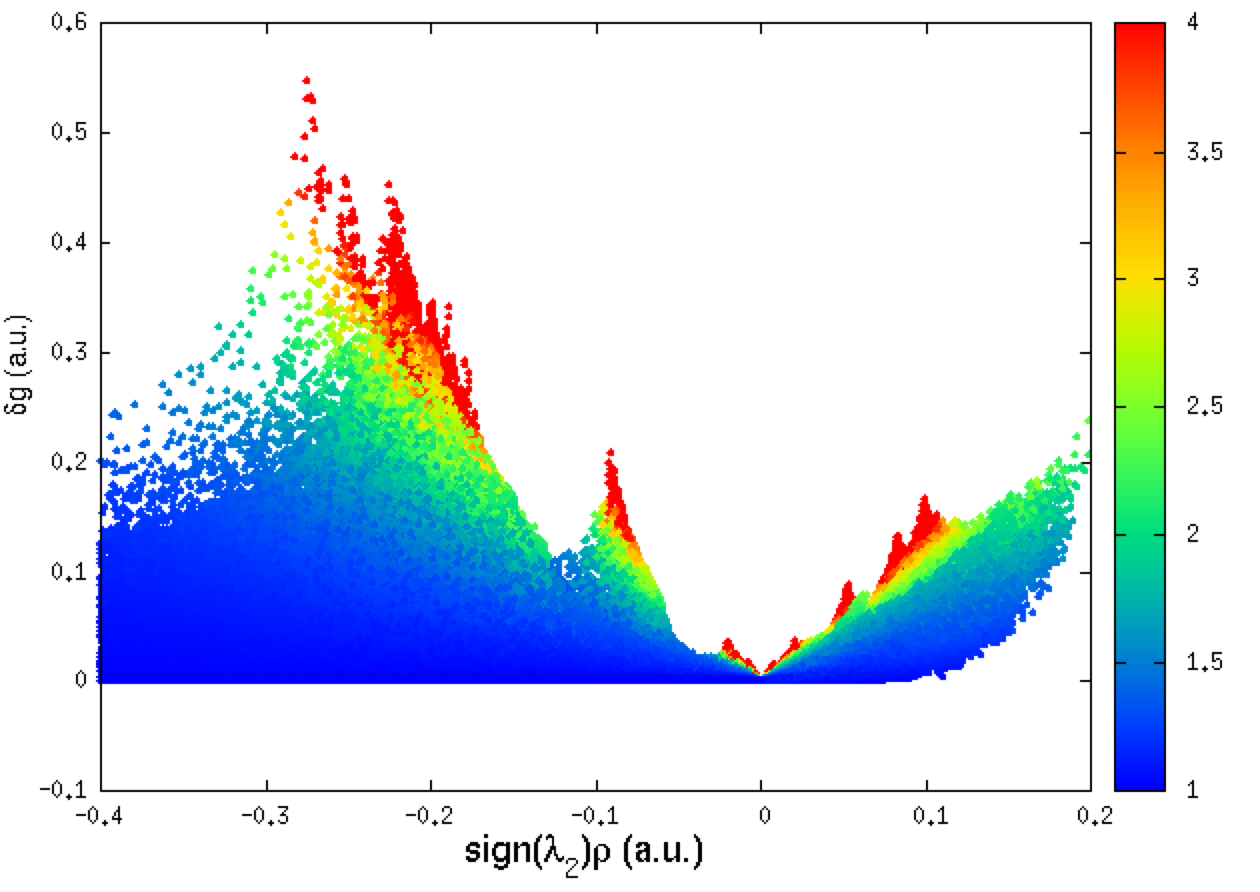
Very curiously, in the “intra” 2D-fingerprint (left panel above), a δg peak appears around ED=-0.09 a.u., a low ED domain, but with a strong value of δg (0.2 a.u.), really unexpectedly large for such a low ED! We will try to find out the origin of this peak later on.
3D-isosurfaces
We are going now to use the igm.vmd file generated by IGMPlot to identify the regions of space where interactions take place. This file must be located in the folder containing the cube files while running VMD.♥ The script igm.vmd uses .cube files present in the directory. Since igm.vmd is generated by IGMPlot in the folder where the calculation took place, if, in the meantime, cube files have been moved elsewhere by you, you must edit and modify igm.vmd by yourself so that to adjust to your current path the path to these cube files in igm.vmd (on your own computer, the path pointing towards folder containing igm.vmd). Look in the script igm.vmd lines specifying path like:
mol new /gpfs1/home/username/IGMPLOT/TutoWeb/1_waterDimerPromol/a_singleFragment/mol-dgInter.cube type cube first 0 last -1 step 1 filebonds 1 autobonds 1 waitfor all
and replace it with:
mol new /your_own_path/mol-dgInter.cube type cube first 0 last -1 step 1 filebonds 1 autobonds 1 waitfor all
Rather than doing it manually, another possibility is to make use of the vmdpath command provided in the electronic material, simply by typing in the terminal: vmdpath igm.vmd. This will generate a new file called igmLocal.vmd with appropriate file paths.
Run VMD and load the igm.vmd session file (menu File/load Visualization state). Two windows appear: the VMD main window and the molecular viewer.
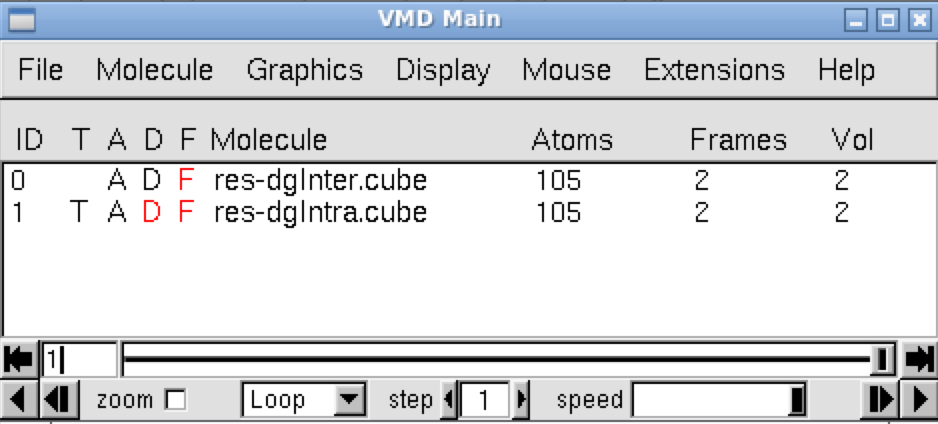
In the VMD main panel appear two “Molecules” lines (res-dgInter.cube and res-dgIntra.cube). Default of the script igm.vmd is to display the interactions between fragments: resdgInter.cube Molecule (button D is activated). Here, default is then to display the interactions between the copper complex and the fullerene.
The molecular system appears in the molecular viewer in “ball & sticks” representation. Press “S” to scale the picture, “T” to translate or “R” to rotate.
The resulting δg_inter isosurface clearly reveals the substantial contribution of the three copper atoms.
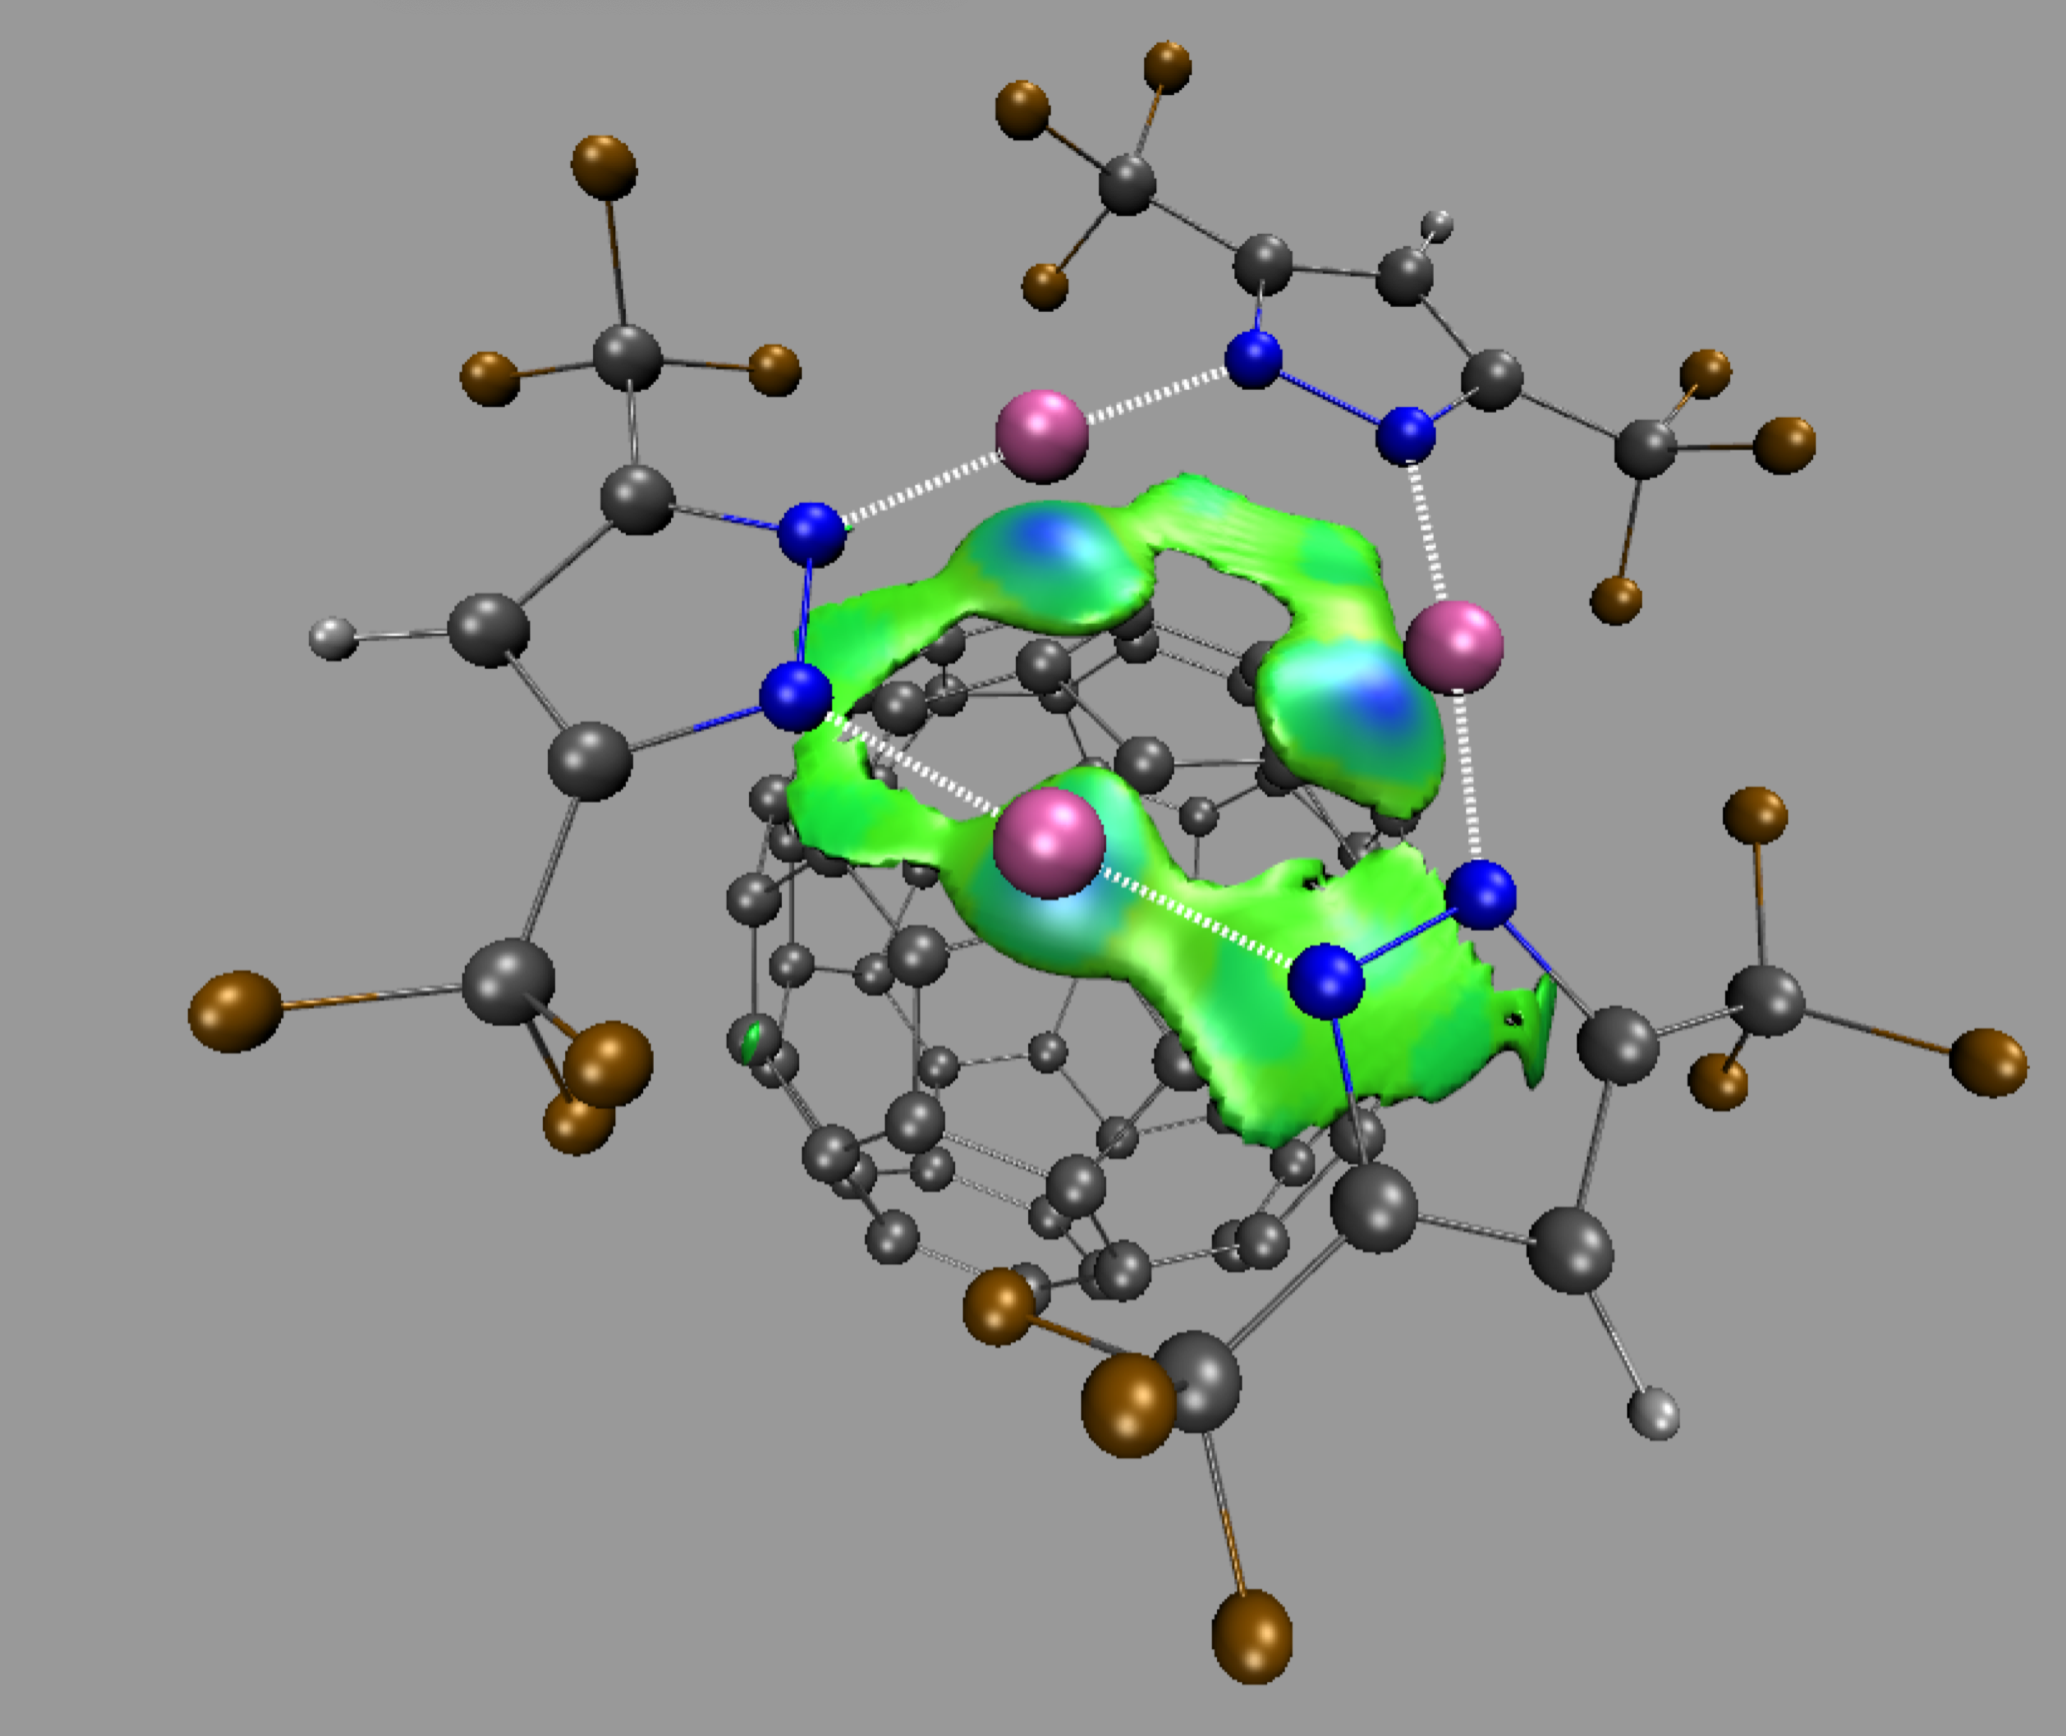
Since δg captures ED clash between different sources (atoms, fragments, molecules) such δg isosurfaces give rise to a coherent picture with stabilizing interactions accumulated in the center of several envelopes.
Note: the default δg isovalue = 40% of the maximum peak height found by IGMPlot in the 2D-finger-print. Changing the iso-value will change the size of the isosurfaces. To do that, go to the menu Graphics/Representations, select the “Isosurface” representation (by clicking on it) and change the “Isovalue” number in the panel, to gradually grow or diminish the volume enclosed in the envelops. The larger the isovalue, the larger the ED interaction.
If you want to display the resdgIntra.cube representation Double-click on the “D” letter of res-dgInter.cube Molecule to hide it and Double-click on the “D” letter of resdgIntra.cube Molecule to enable it.
Atomic decomposition
Furthermore, in addition to the igm.vmd session file, the AtContribInter.vmd session file allows you for another visualization: the atoms of the complex are colored according to their contribution to the δg_inter interaction isosurfaces, on a BGR scale. Blue: no contribution, Red: maximum of contribution. The percentages are directly taken by VMD in the mol-AtContribInter.dat file that you can edit separately (just to have a look).Exit VMD, and re-run VMD to load the AtContribInter.vmd session file. This will lead to:
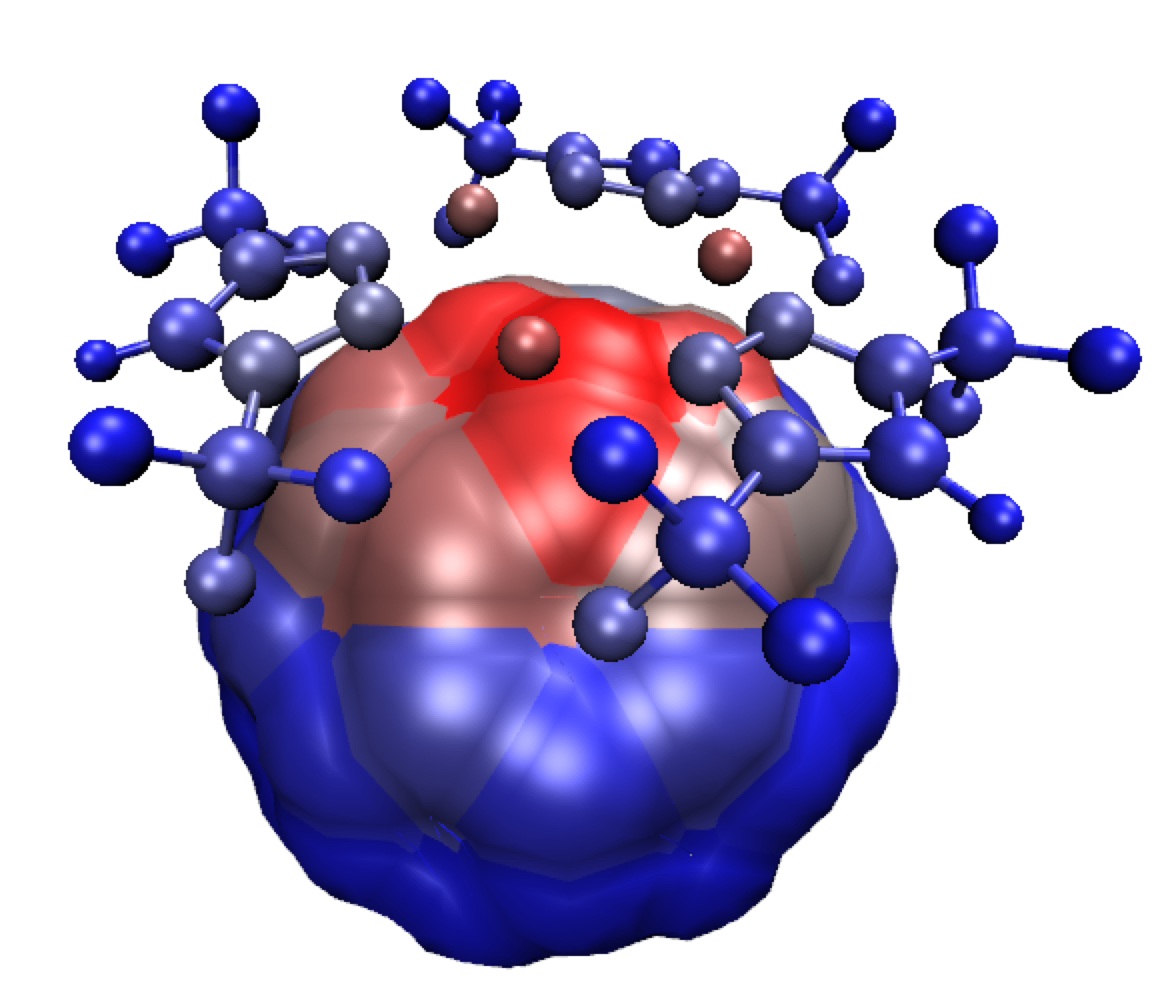
You can customize the graphical representation as follows:
- In VMD, go to the menu Graphics/Representations and select the Surf representation (first line)
- In the scrolling menu Drawing Method select the Licorice method
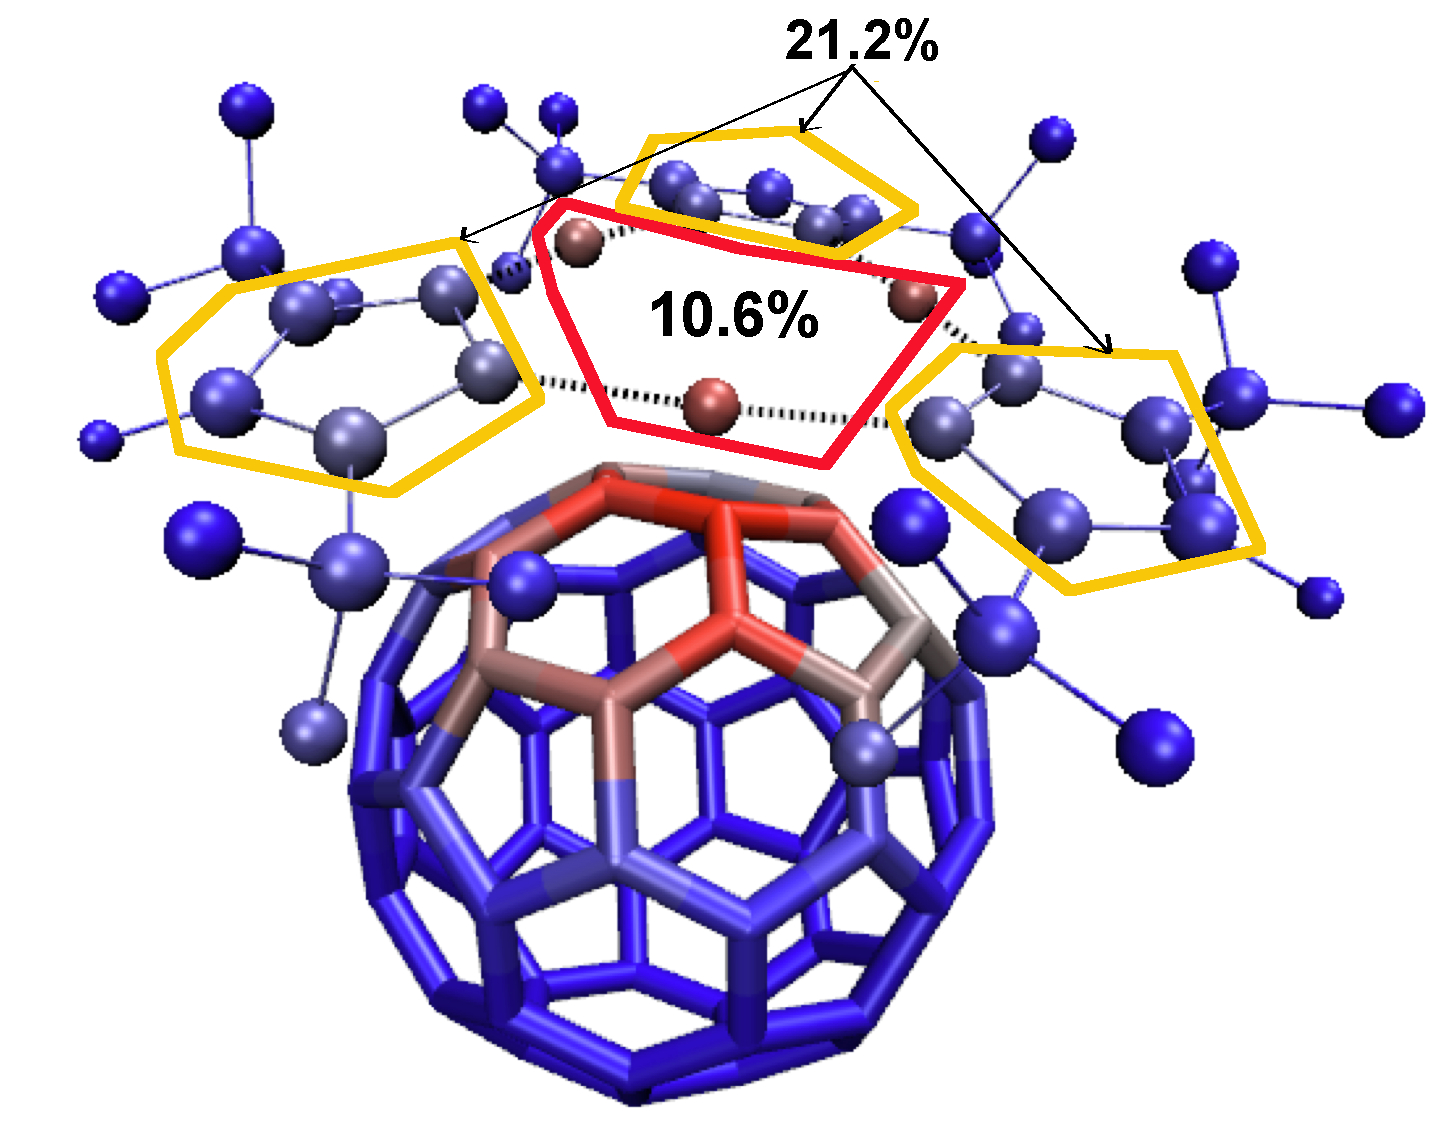
Using the atomic contributions reported in file mol-AtContribInter.dat (in % for instance) you can decipher the contributions of every subpart of the system to the total intermolecular interaction. Such information offers insights into the targeted design of molecular recognition.
IGM interaction quantification
In the igm.log output file, two sections are reported with information on INTER (between fragments) and INTRA (within fragments) molecular interactions.In the INTER section, note immediately that IGMPlot has detected the MAXIMUM of the δg peak(s) = "4.1003e-02 a.u.", classifying this interaction in the “non-cov” domain on the indicative IGM peak scale:
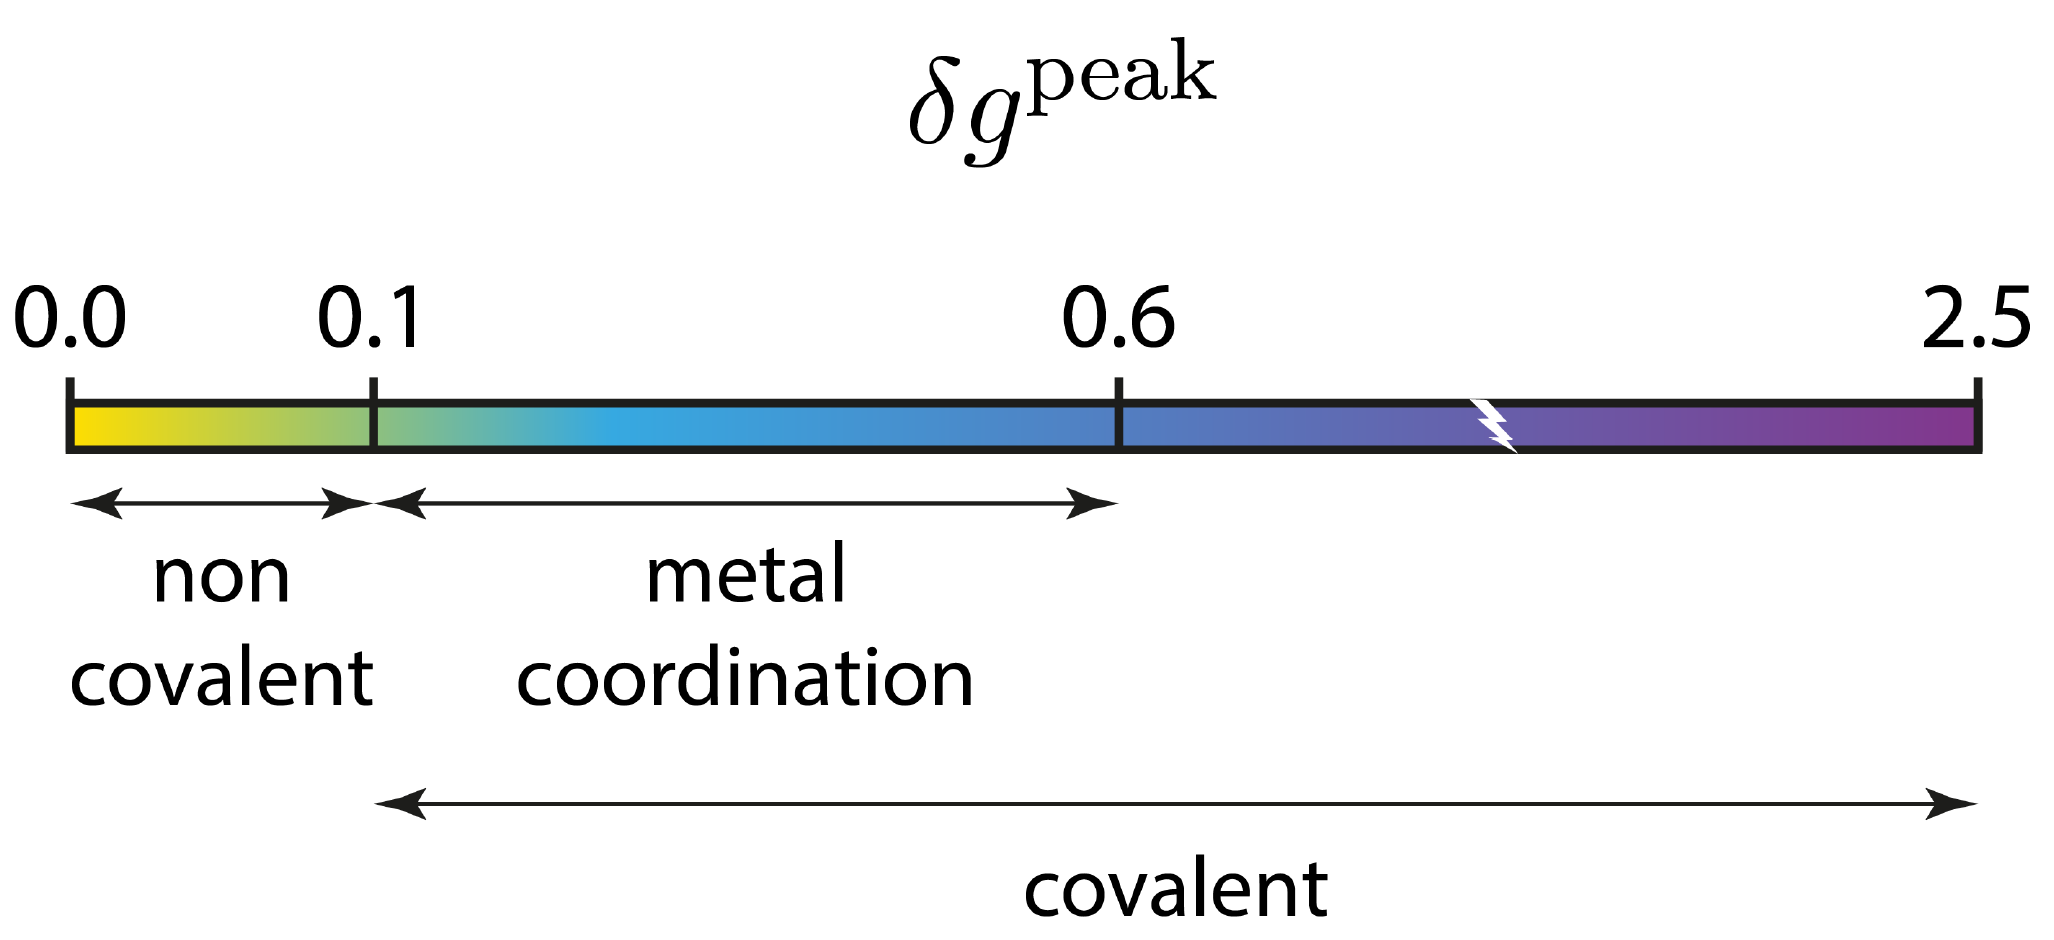
Noteworthy, the magnitude of this interaction lies in between that of the typical hydrogen-bond in the water dimer (δg_peak = 0.06 a.u.) and that of the π-stacking present in the benzene dimer (δg_peak = 0.01 a.u.).
Next, a number of integrated scores are reported. Herafter are described the meanings of the scores given in the igm.log output.
The score [1] corresponds to the full integration of δg. Thus, every point in the grid is taken into account, and all the δg values are summed and weighted by the elementary volume dv of each grid cell. The [1a] score is the same as [1] except that only those points of the grid for which λ2 > 0 are considered. The [1b] score is the same as [1] except that only those points of the grid for which λ2 < 0 are considered. Thus, [1] = [1a] + [1b]. The separated scores [1a] and [1b] have been implemented upon user request since the sign of λ2 is used in the original NCI paper by Yang to characterise the kind of interaction in the interatomic regions (bonding situation when λ2 < 0 and non-bonding when λ2 > 0).
Next, the score [2] (similar to [1b]) corresponds to the integration of grid points for which λ2 < 0 and for which the signed electron density rho : -0.09 < ρ < 0.09 and for which qg > 1.3. This score aims at extracting and quantifying only weak interactions in a given 2D-plot signature. The latter condition allows to get a score focusing only on the peaks of the 2D-plot fingerprint, removing points of low ED contragradience (the flat part of the signal), making the score [2] more sensitive to the interaction situation. Here, IGMPlot detects some weak interactions between the two fragments, with a total integrated amount of 9.288e-01 a.u..
The score [3] is similar to [2] but extracts and quantifies strong (covalent) interactions in a given 2D-plot signature. Note that here, absolutely no strong interactions are detected between the fragments (no covalent bonding between the fragments). Of course, the integration of the IGM-δg descriptor cannot be expected to lead as accurate results as QM calculations or IQA, but it offers a fast and robust way to get an order of magnitude of interactions comparing different systems or during their evolution along a reaction.
Note the energy of interaction [4] estimated by IGMPlot in the igm.log output: -3.788e+01 kcal/mol. It is a large value since many interactions occur because of the size of the interaction interface. However, note that for now IGMPlot provides a crude estimate of this interaction energy in kcal/mol. Much must be done now to extend this estimation to other types of atoms, and in particular by extending the calibration range limited to 40 kcal.mol-1 in the present version, and by leveraging AI algorithms. Thus, until now, integration scores are more relevant to compare interactions between different situations.
2) Focusing on a specific window in the 2D-fingerprint
Go to directory: 2_Intra_refinementIt is possible to focus on a specific region of the 2D-fingerprint by using the PEAKFOCUSINTRA keyword. For instance, to restrain the 3D-isosurfaces of the IGM δg_intra analysis to the interval -0.15 < ED < -0.06 a.u. (the “?” peak appearing in the above δg_intra 2D-fingerprint), edit and save the following param.igm file:
2
frag1.xyz
frag2.xyz
PEAKFOCUSINTRA -0.15 -0.06
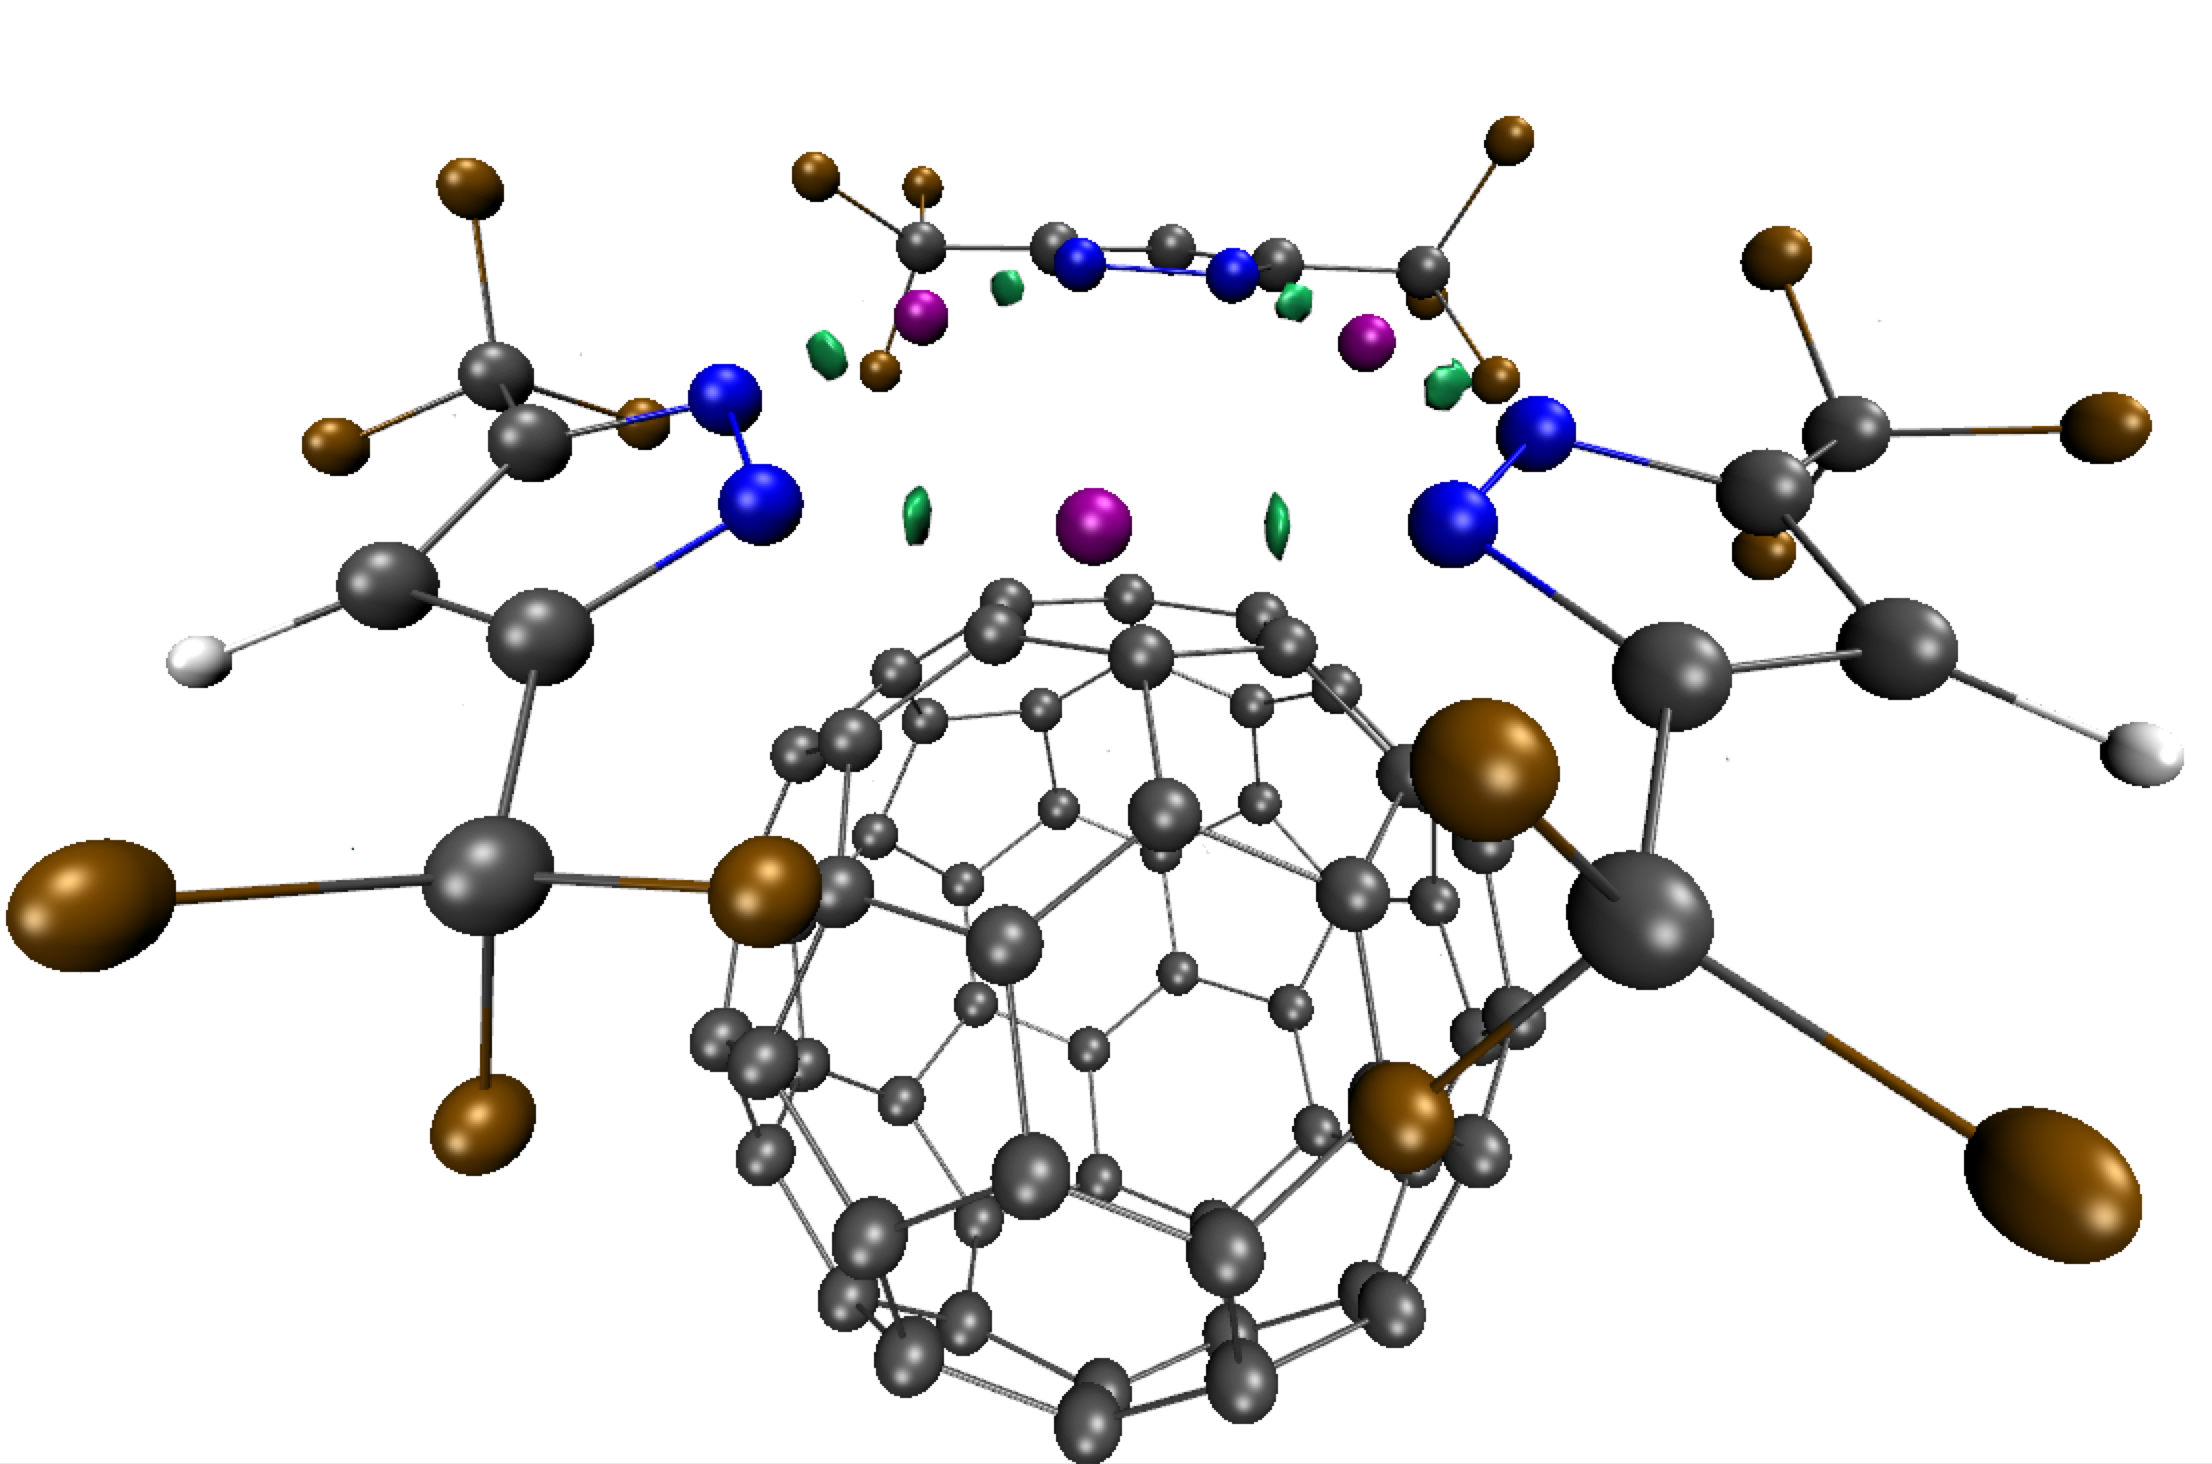
(0.14 δg_intra isosurfaces limited to the ED window [-0.15:-0.05])
This analysis shows that the "?" peak on the 2D-fingerptint corresponds to metal-ligand coordination bonding, featuring smaller bond strength than pure covalent bonding peaks. Note however that a correct treatment would involve using a wave function description of the system since metal-ligand interactions have covalent features, then using promolecular ED here is not appropriate, although giving a relevant relative ranking of the different kinds of interactions.