back to summary
-
You can access the necessary files for this tutorial by downloading this
archive. Once downloaded, place it in a convenient location and extract its contents:
[user]$ tar -xvjf 2_waterDimer.tbz2
Unpacking the archive will create a directory called 2_waterDimer/, wherein this tutorial will be conducted. - The results of the calculations can be found in this archive_results.
II. Iconic example: the water dimer
Change directory to: 2_waterDimerThe water dimer can be seen either made of one single block or defined as two interacting fragments. An attractive feature of the IGM methodology is to provide an uncoupling scheme intra/inter that automatically extracts the signature of intra- (𝛿𝑔intra) and inter-( 𝛿𝑔inter) molecular interactions between two user-defined fragments for drawing the corresponding 3D isosurface representations in real space with software like VMD. This automatic intra/inter separation can be carried out either using promolecular ED or ED coming from QM calculations (wave function mode). The user has only to supply the definition of two fragments in terms of two .xyz input files (promolecular mode) or in terms of two keywords FRAG1/FRAG2 in the param.igm input file (atom indexes of the two fragments are then supplied, in the QM mode). In the following, we will see the two possibilities: the molecule is seen as a single block or as two fragments.
1) Promolecular mode
Change directory to folder 1_waterDimerPromol of the supplied materiala) Dimer considered as one single block
Go to the directory a_singleFragment. Build and save the following param.igm input file (this param.igm file must be located in the same directory as the supplied mol.xyz file):
1
mol.xyz
- 1 --> one single file describes the system
- mol.xyz --> the name of this file --> here, the promolecular model of the electron density will be implemented (when the .xyz file format is detected)
- IGMPLOT: the executable name of the IGMPlot program
- param.igm: the input file
- > igm.log: standard output will be redirected to file igm.log
- &: command is run in background
Have a look at the resulting output files list:
- igm.log: text outputfile of the IGM execution
- igm.vmd: VMD script to automatically display δg 3D isosurfaces
- mol-dens.cube: cube file describing the electron density (ED) at each node of the grid
- mol-dgInter.cube: cube file describing the δg_inter value at each node of the grid
- mol-dgIntra.cube: cube file describing the δg_intra value at each node of the grid
- mol-igm.dat: file with data in columns to be used with GNUPLOT to generate 2D-fingerprints
- mol-nci.dat: file with data in columns to display the RDG=f(ED) 2D-plot
- mol-RDG.cube: cube file describing the Reduced Density Gradient value at each node of the grid
- nci.vmd: VMD script to automatically display RDG 3D isosurfaces
1
mol.xyz
ONAME myfilename
2D-fingerprint
We are now going to analyse the interaction 2D-fingerprint: the δg = f(signed ED) plot. The sign of λ2 (the second eigenvalue of the ED hessien) is used (as in the original NCI paper by Yang in 2010) to characterise the kind of interaction in the interatomic regions (bonding situation when λ2 < 0 and non-bonding when λ2 > 0).Edit the mol-igm.dat output file with a text editor and have a look. Six columns can be used to plot the δg-fingerprint:
- Column 1: signed ED
- Column 2: RDG (for NCIplot representation)
- Column 3: δg-intra descriptor: quantifies the interactions inside each fragment
- Column 4: δg -inter: quantifies the interactions between the two fragments
- Column 5: qg-intra descriptor: the 'quotient' twin descriptor of δg-intra
- Column 6: qg-inter descriptor: the 'quotient' twin descriptor of δg-inter
Exit the file and use for instance GNUPLOT to get the δg fingerprint using columns 1 and 3.
In a Linux terminal, type the command gnuplot and next (in the gnuplot environment):
-> plot “mol-igm.dat” u 1:3 every ::1
Here, the x-axis = signed ED (column 1 in mol-igm.dat), the y-axis = δg-intra (column 3 in mol-igm.dat).
To improve the quality of the picture, you can type: ->
plot "mol-igm.dat" u 1:3 every ::1 pt 7 lw 3 ps 1.2 notitle
- plot: GNUPLOT command to plot data contained in a file
- "mol-igm.dat": the name of the file where to retrieve the data to be plotted
- every ::1 : skipps the first line (header)
- u 1:3 : using columns 1(x axis) and 3(y axis).
- pt 7: point type number 7
- lw 3: line width
- ps 1.2: point size
- notitle: no title will be displayed on the plot
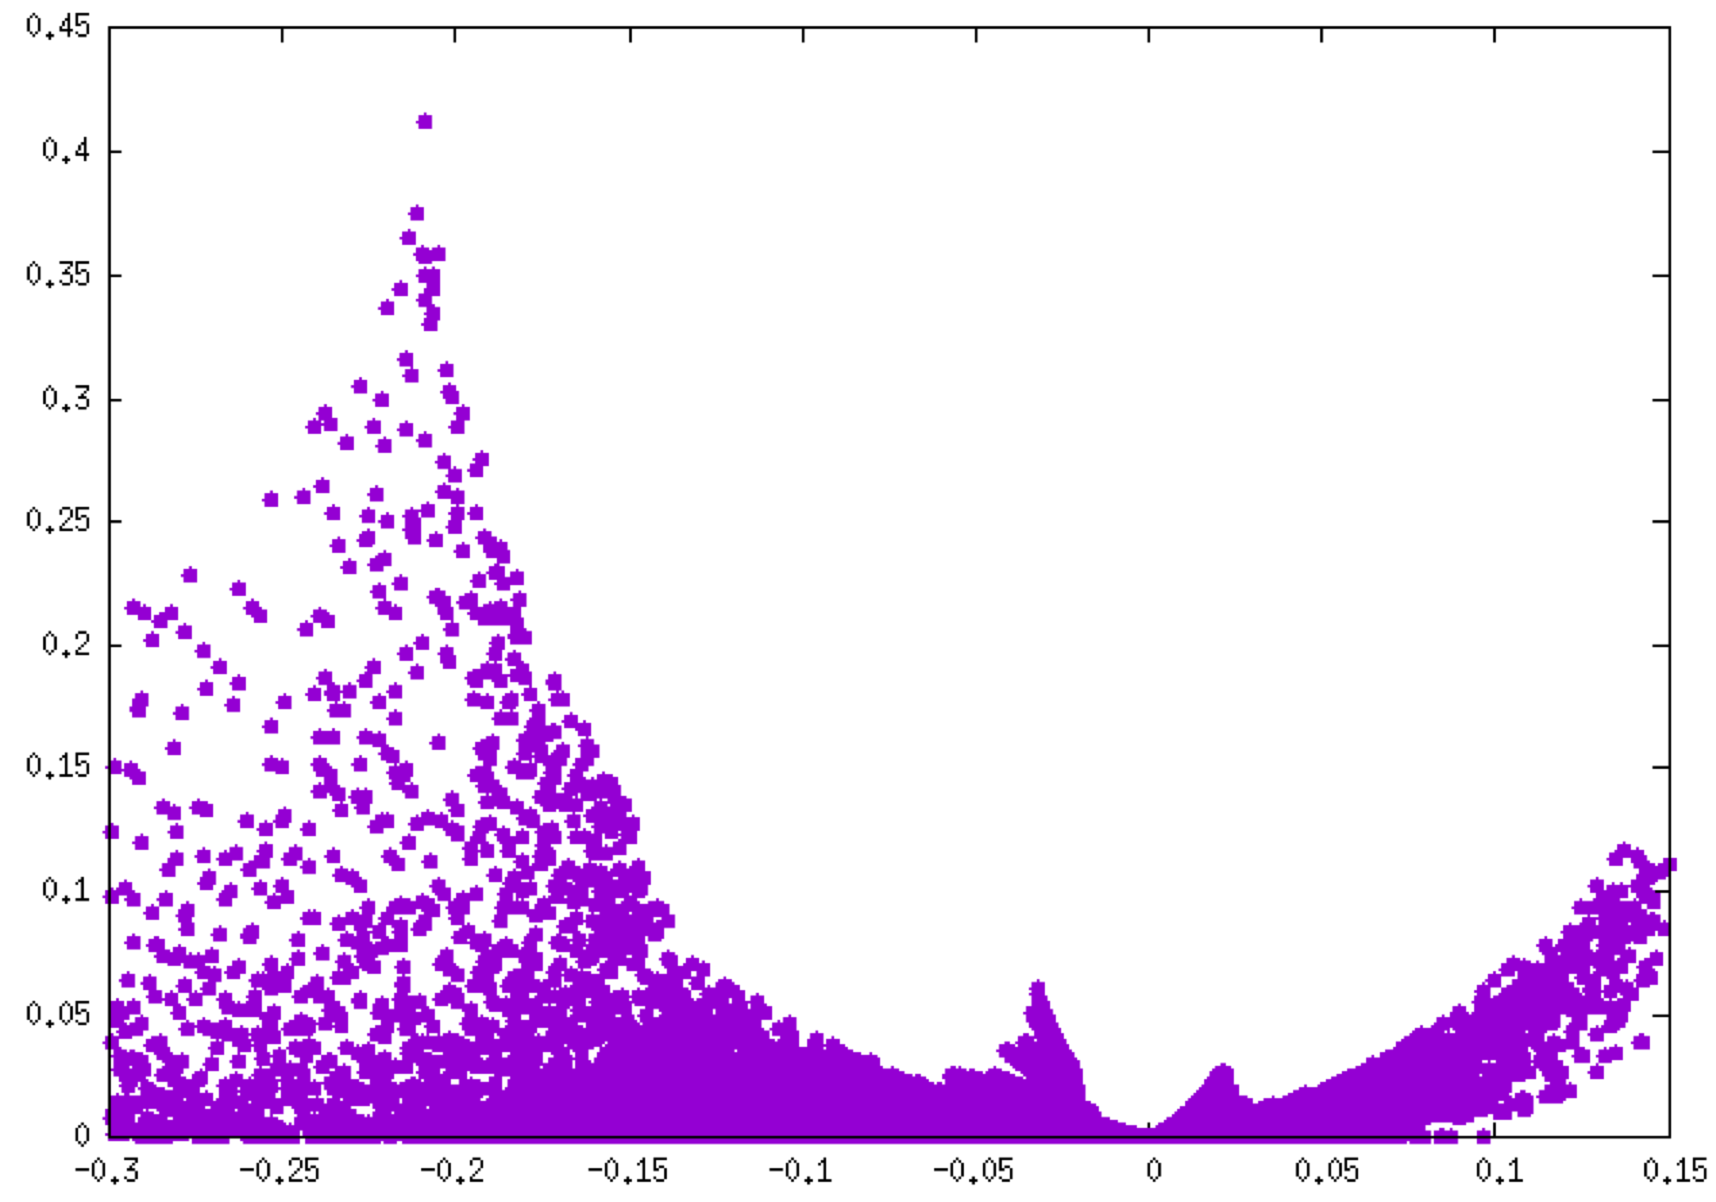
Remind that the negative side of this plot corresponds to interactions occuring in binding regions. One peak = one interaction. The larger the peak, the greater the interaction. The 2D-fingerprint reveals globally 2 peaks on the attractive side of the plot, then two kinds of interactions are detected. Based on our experience, the following δg_peak scaled has been derived, which helps in identifying the kind of interaction:
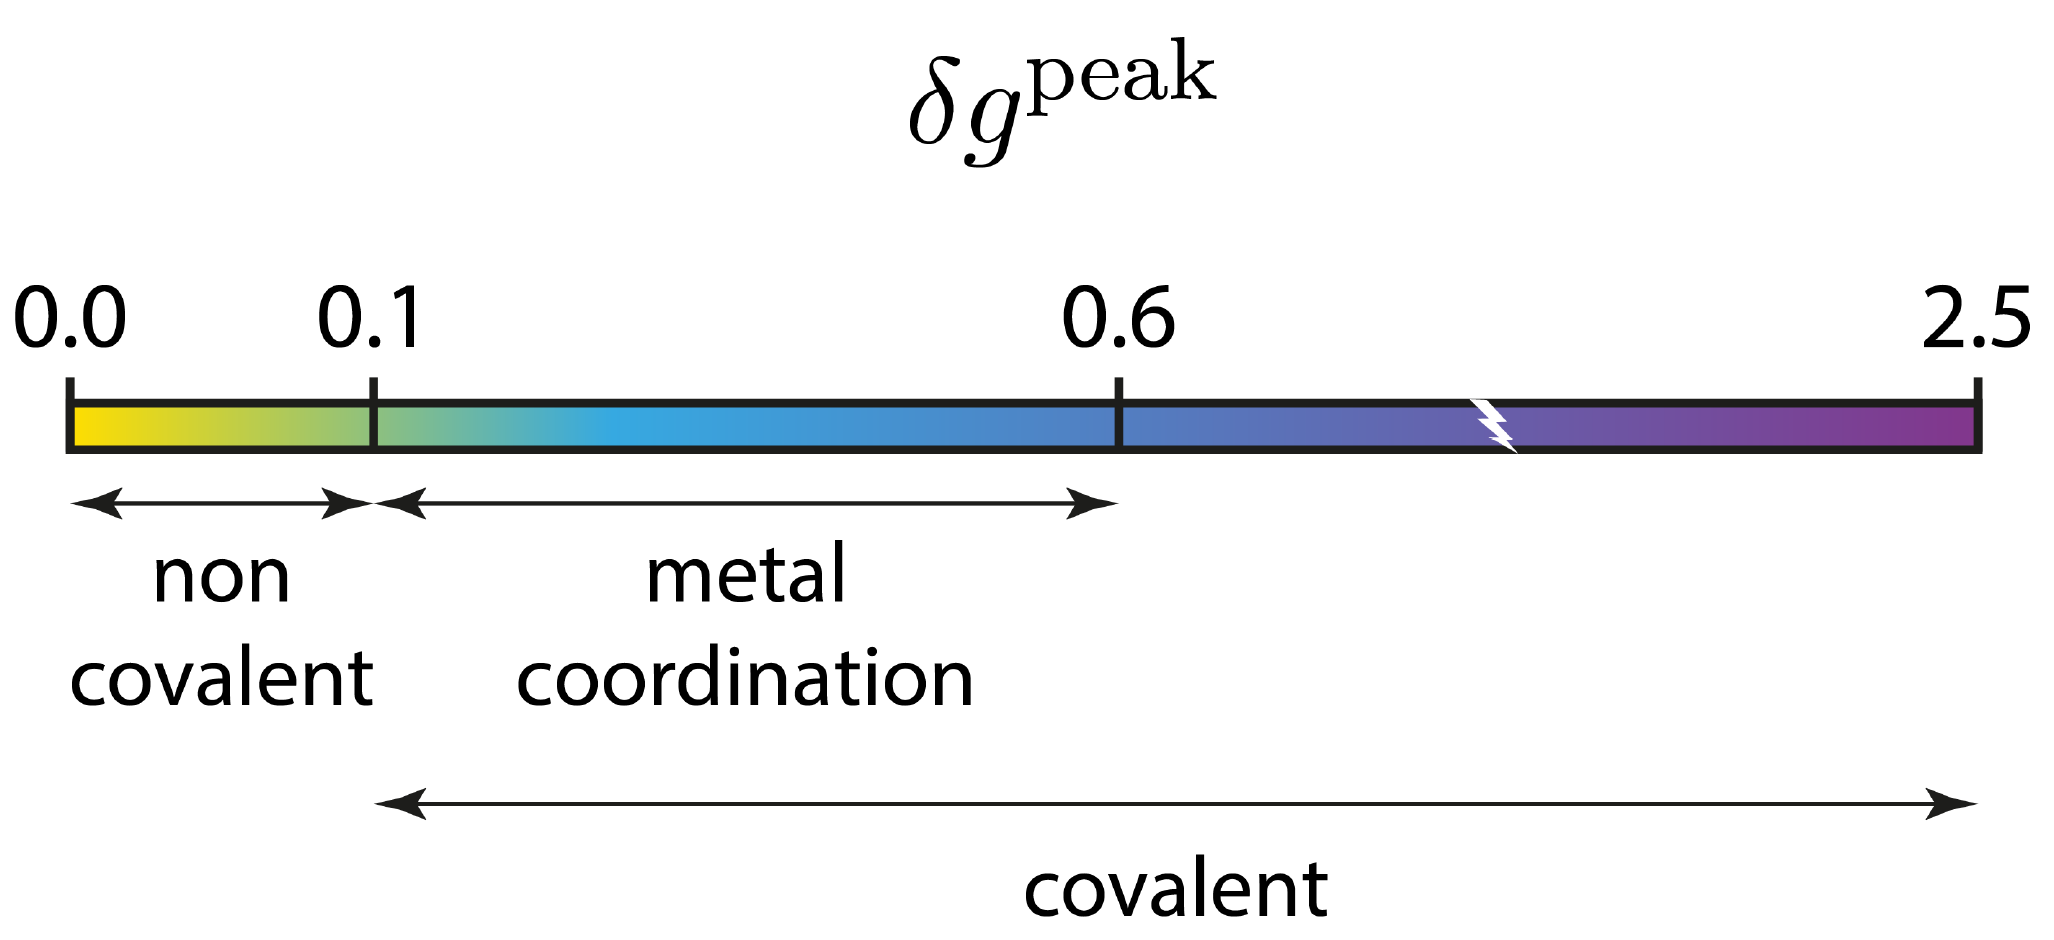
Clearly, the peak in the low ED domain (-0.05 < ED < 0.0 a.u.) corresponds to the hydrogen-bond and the other oberved at larger electron density (peak around -0.2 a.u.) is associated to the covalent O-H bond.
We are now going to use the twin descriptor of δg, namely: qg, in order to color each point of this δg=f(ED) 2D-fingerprint according to the qg value to emphasize peaks on the plot. To do that, within the GNUPLOT session, type:
set palette rgbformulae 22,13,-31
set cbrange[1:4]
plot "mol-igm.dat" every ::1 u 1:3:5 notitle pointtype 7 ps 0.8 palette
- set palette rgbformulae 22,13,-31 --> palette definition to color each point
- set cbrange[1:4] --> range of the qg color scale (1 <-> no interaction)
- every ::1 --> skips line 1 (the header)
- u 1:3:5 --> using columns 1 (signed ED), 3 (δg_intra) and 5 (qg_intra)
- palette --> color according to column 5
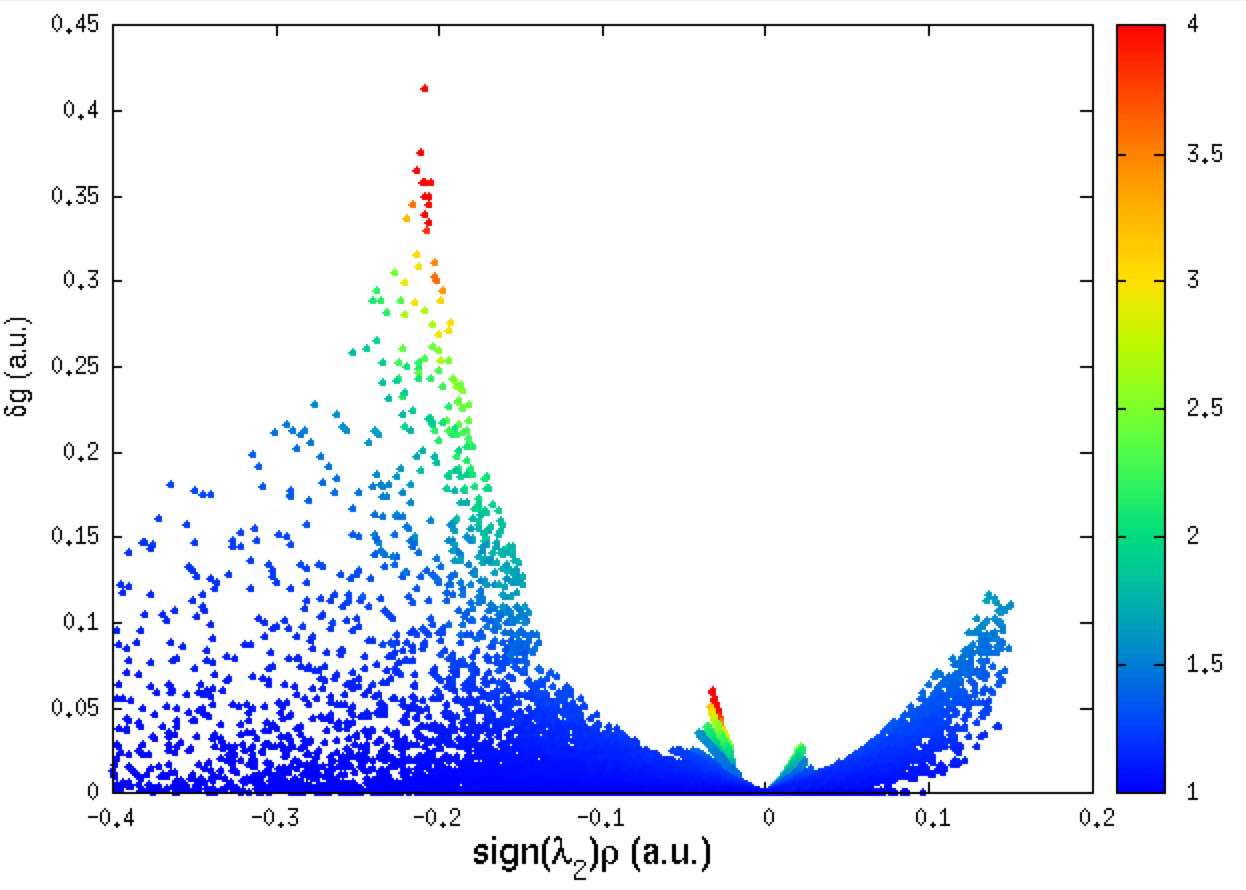
Note that you can still improve your Figure by setting in GNUPLOT the x and y axis titles:
set xlabel "sign({/Symbol l}_2){/Symbol r} (a.u.)" font "Helvetica,18" offset 0.0, 0.1
set ylabel "{/Symbol d}g (a.u.)" font "Helvetica,14" offset 0.2, 0.0
The corresponding NCI plot can also be obtained and colored thanks to the IGM qg descriptor by using columns 1,2 and 5 here (one single fragment) within the gnuplot environment:
set xlabel "sign({/Symbol l}_2){/Symbol r} (a.u.)" font "Helvetica,18" offset 0.0, 0.1
set ylabel "RDG" font "Helvetica,14" offset 0.2, 0.0
set palette rgbformulae 22,13,-31
set cbrange[1:4]
set xrange[-0.25:0.1]
set yrange[0:2]
plot "mol-igm.dat" u 1:2:5 every ::1 notitle pointtype 7 ps 0.8 palette
(u 1:2:5 <-> uses the second column 2 to plot RDG instead of δg)
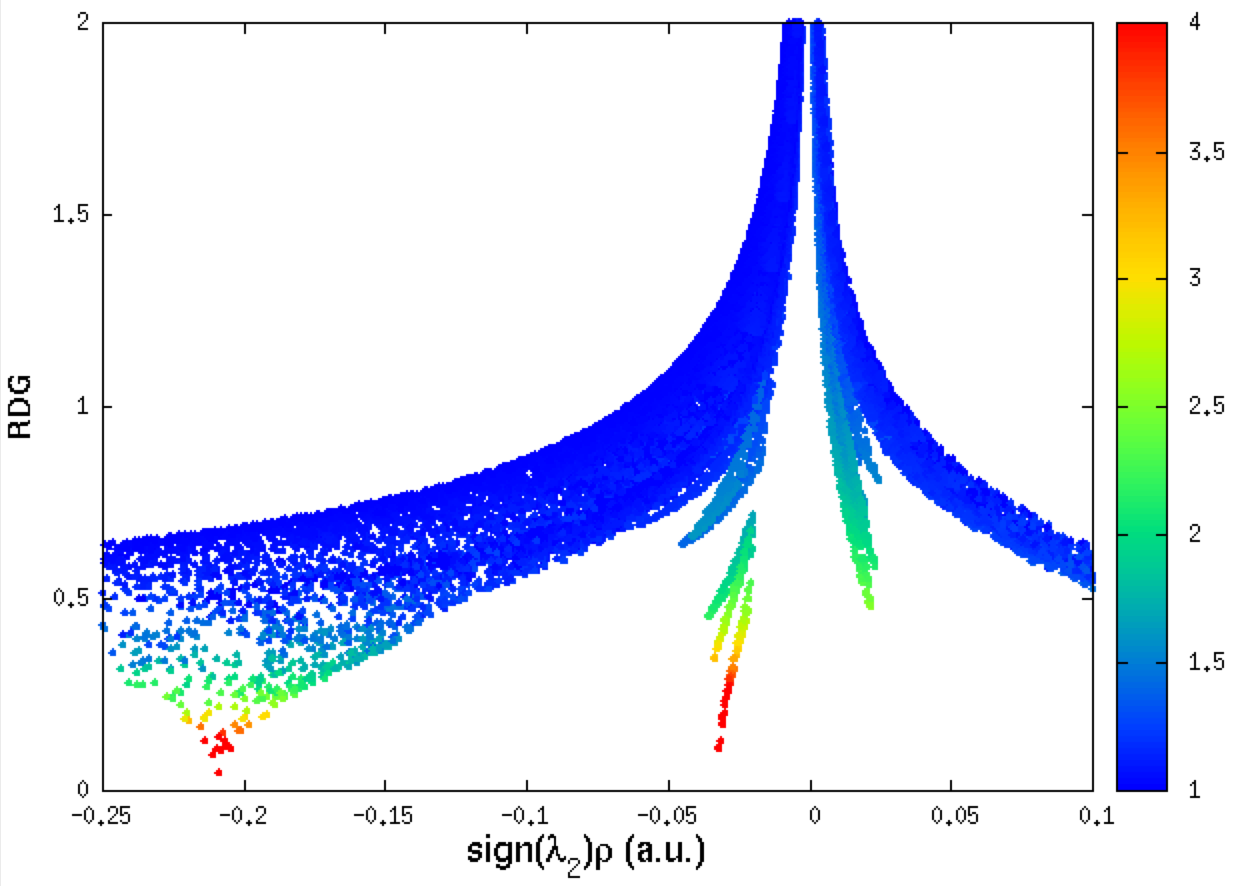
Note that, on the attractive side (negative value of ED signed by λ2) the two peaks on the IGM plot match the two drops on the NCI plot. One can easily guess that these two peaks correspond to: the covalent bonding on the one hand, and to the hydrogen-bond on the other hand. This can be checked by building iso-surfaces in real space (next section).
3D-isosurfaces
We are going now to use the igm.vmd file generated by IGMPlot to identify the regions of space where interactions take place. This file must be located in the folder containing the cube files while running VMD. Exit GNUPLOT. Run VMD and load the igm.vmd session file (menu File/load Visualization state). The water dimer appears in “ball & sticks” representation. Press “S” to scale the picture, “T” to translate or “R” to rotate.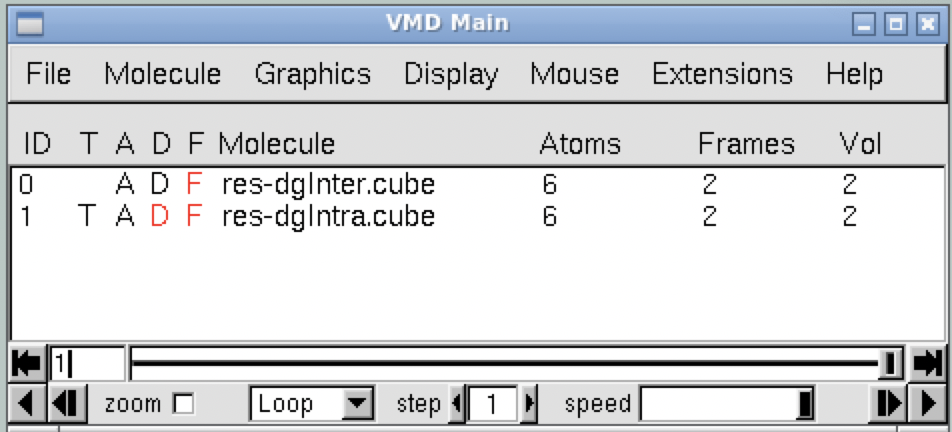
In the VMD main panel appear two “Molecules” (res-dgInter.cube and res-dgIntra.cube). Default of file igm.vmd is to display the interactions between fragments: resdgInter. cube Molecule (button D is activated). In our case however, no interaction is present in the “Inter” cube since no fragment have been defined by the user. All the interactions are represented in the res-dgIntra.cube Molecule. Double-click on the “D” letter of res-dgInter.cube Molecule to hide it and Double-click on the “D” letter of resdgIntra. cube Molecule to enable it: δg_Intra isosurfaces appear in the main panel of VMD. Since δg captures ED clash between different sources (atoms, fragments, molecules) such δg isosurfaces give rise to a coherent picture with stabilizing interactions accumulated in the center of several envelopes.
Note: the default δg isovalue = 40% of the maximum peak height found by IGMPlot in the 2D-finger-print.
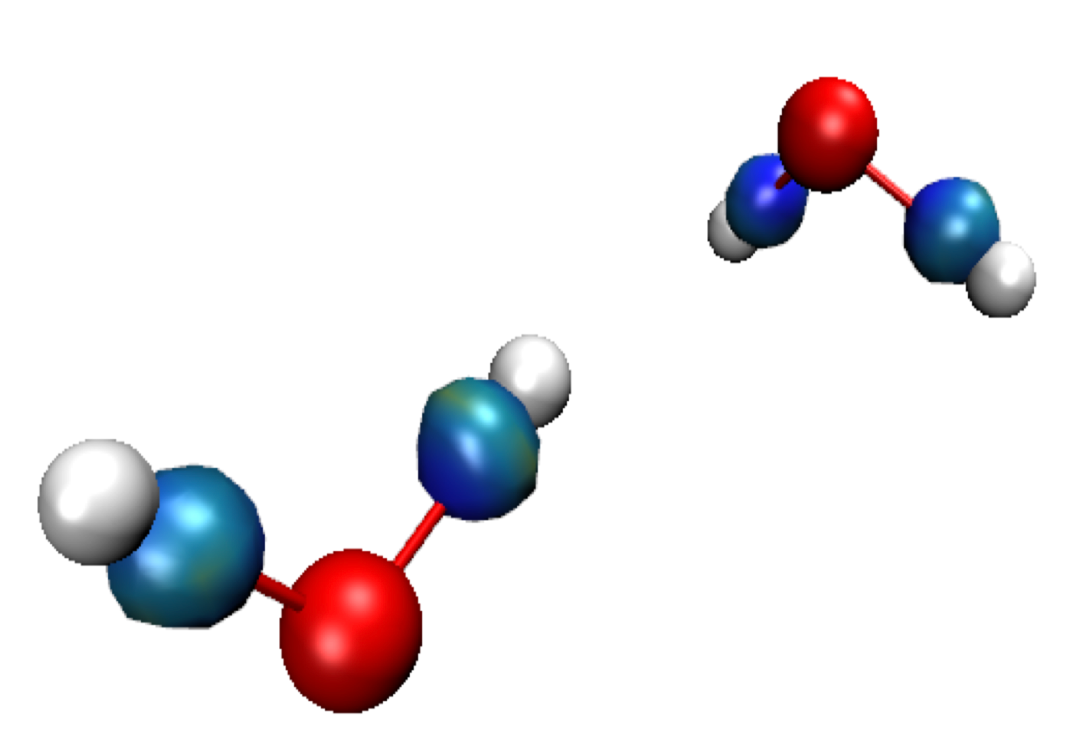
For now (with the default iso-value), only the covalent bonds O-H are revealed here. Change the 0.165 isovalue in the isosurface graphical representation to 0.100: menu Graphics/Representations, select the “Isosurface” representation (by clicking on it) and change the “Isovalue” number in the panel, to grow or diminish the volume enclosed in the envelops. The larger the isovalue, the larger the ED interaction. Setting the isovalue to 0.05 reveals, in addition to the "bond envelopes" a disc-shape isosurface corresponding to the H-bond.
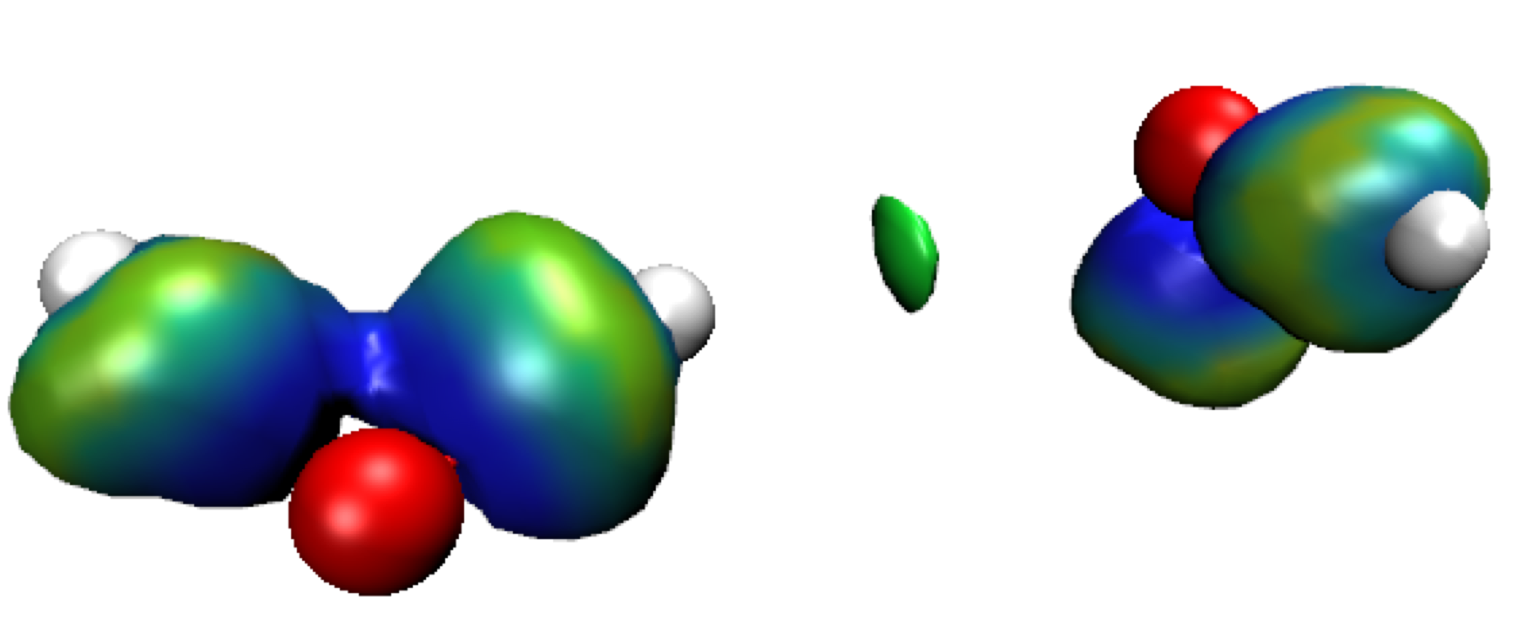
These isosurfaces are colored according to the ED signed by the second eigenvalue of the ED hessien (λ2) on a BGR color scale: Blue = bonding region, Red = non-bonding, Green = very weak interactions (flat green isosurfaces are generally associated to vdW interactions).
Note that nucleus regions are automatically ruled out by the IGM analysis, contrary to the NCIPlot approach. But, at this point, displaying non-covalent iso-surfaces (by choosing a small iso-value) also generates bulky covalent isosurfaces. This inconvenience is suppressed as soon as the "fragment" mode is enabled in IGMPlot (see below). The NCI isosurfaces can also be generated by loading the nci.vmd session separately into VMD program.
♥ The script igm.vmd uses .cube files present in the directory. Since igm.vmd is generated by IGMPlot in the folder where the calculation took place, if, in the meantime, cube files have been moved elsewhere by you, you must edit and modify igm.vmd by yourself so that to adjust to your current path the path to these cube files (on your own computer, the path pointing towards folder containing igm.vmd). Look in the script igm.vmd lines specifying path like:
mol new /gpfs1/home/username/IGMPLOT/TutoWeb/1_waterDimerPromol/a_singleFragment/mol-dgInter.cube type cube first 0 last -1 step 1 filebonds 1 autobonds 1 waitfor all
and replace it with:
mol new /your_own_path/mol-dgInter.cube type cube first 0 last -1 step 1 filebonds 1 autobonds 1 waitfor all
Rather than doing it manually, another possibility is to make use of the vmdpath command provided in the electronic material, simply by typing in the terminal: vmdpath igm.vmd. This will generate a new file called igmLocal.vmd with appropriate file paths.
IGM interaction quantification
Exit VMD. Edit the igm.log file. Note that here, the “Promolecular” ED model has been employed. Two sections are reported with information on INTER (between fragments) and INTRA (within fragments) molecular interactions. Since “no fragment partition” has been defined here the INTER section is empty (“no interaction detected between fragments”).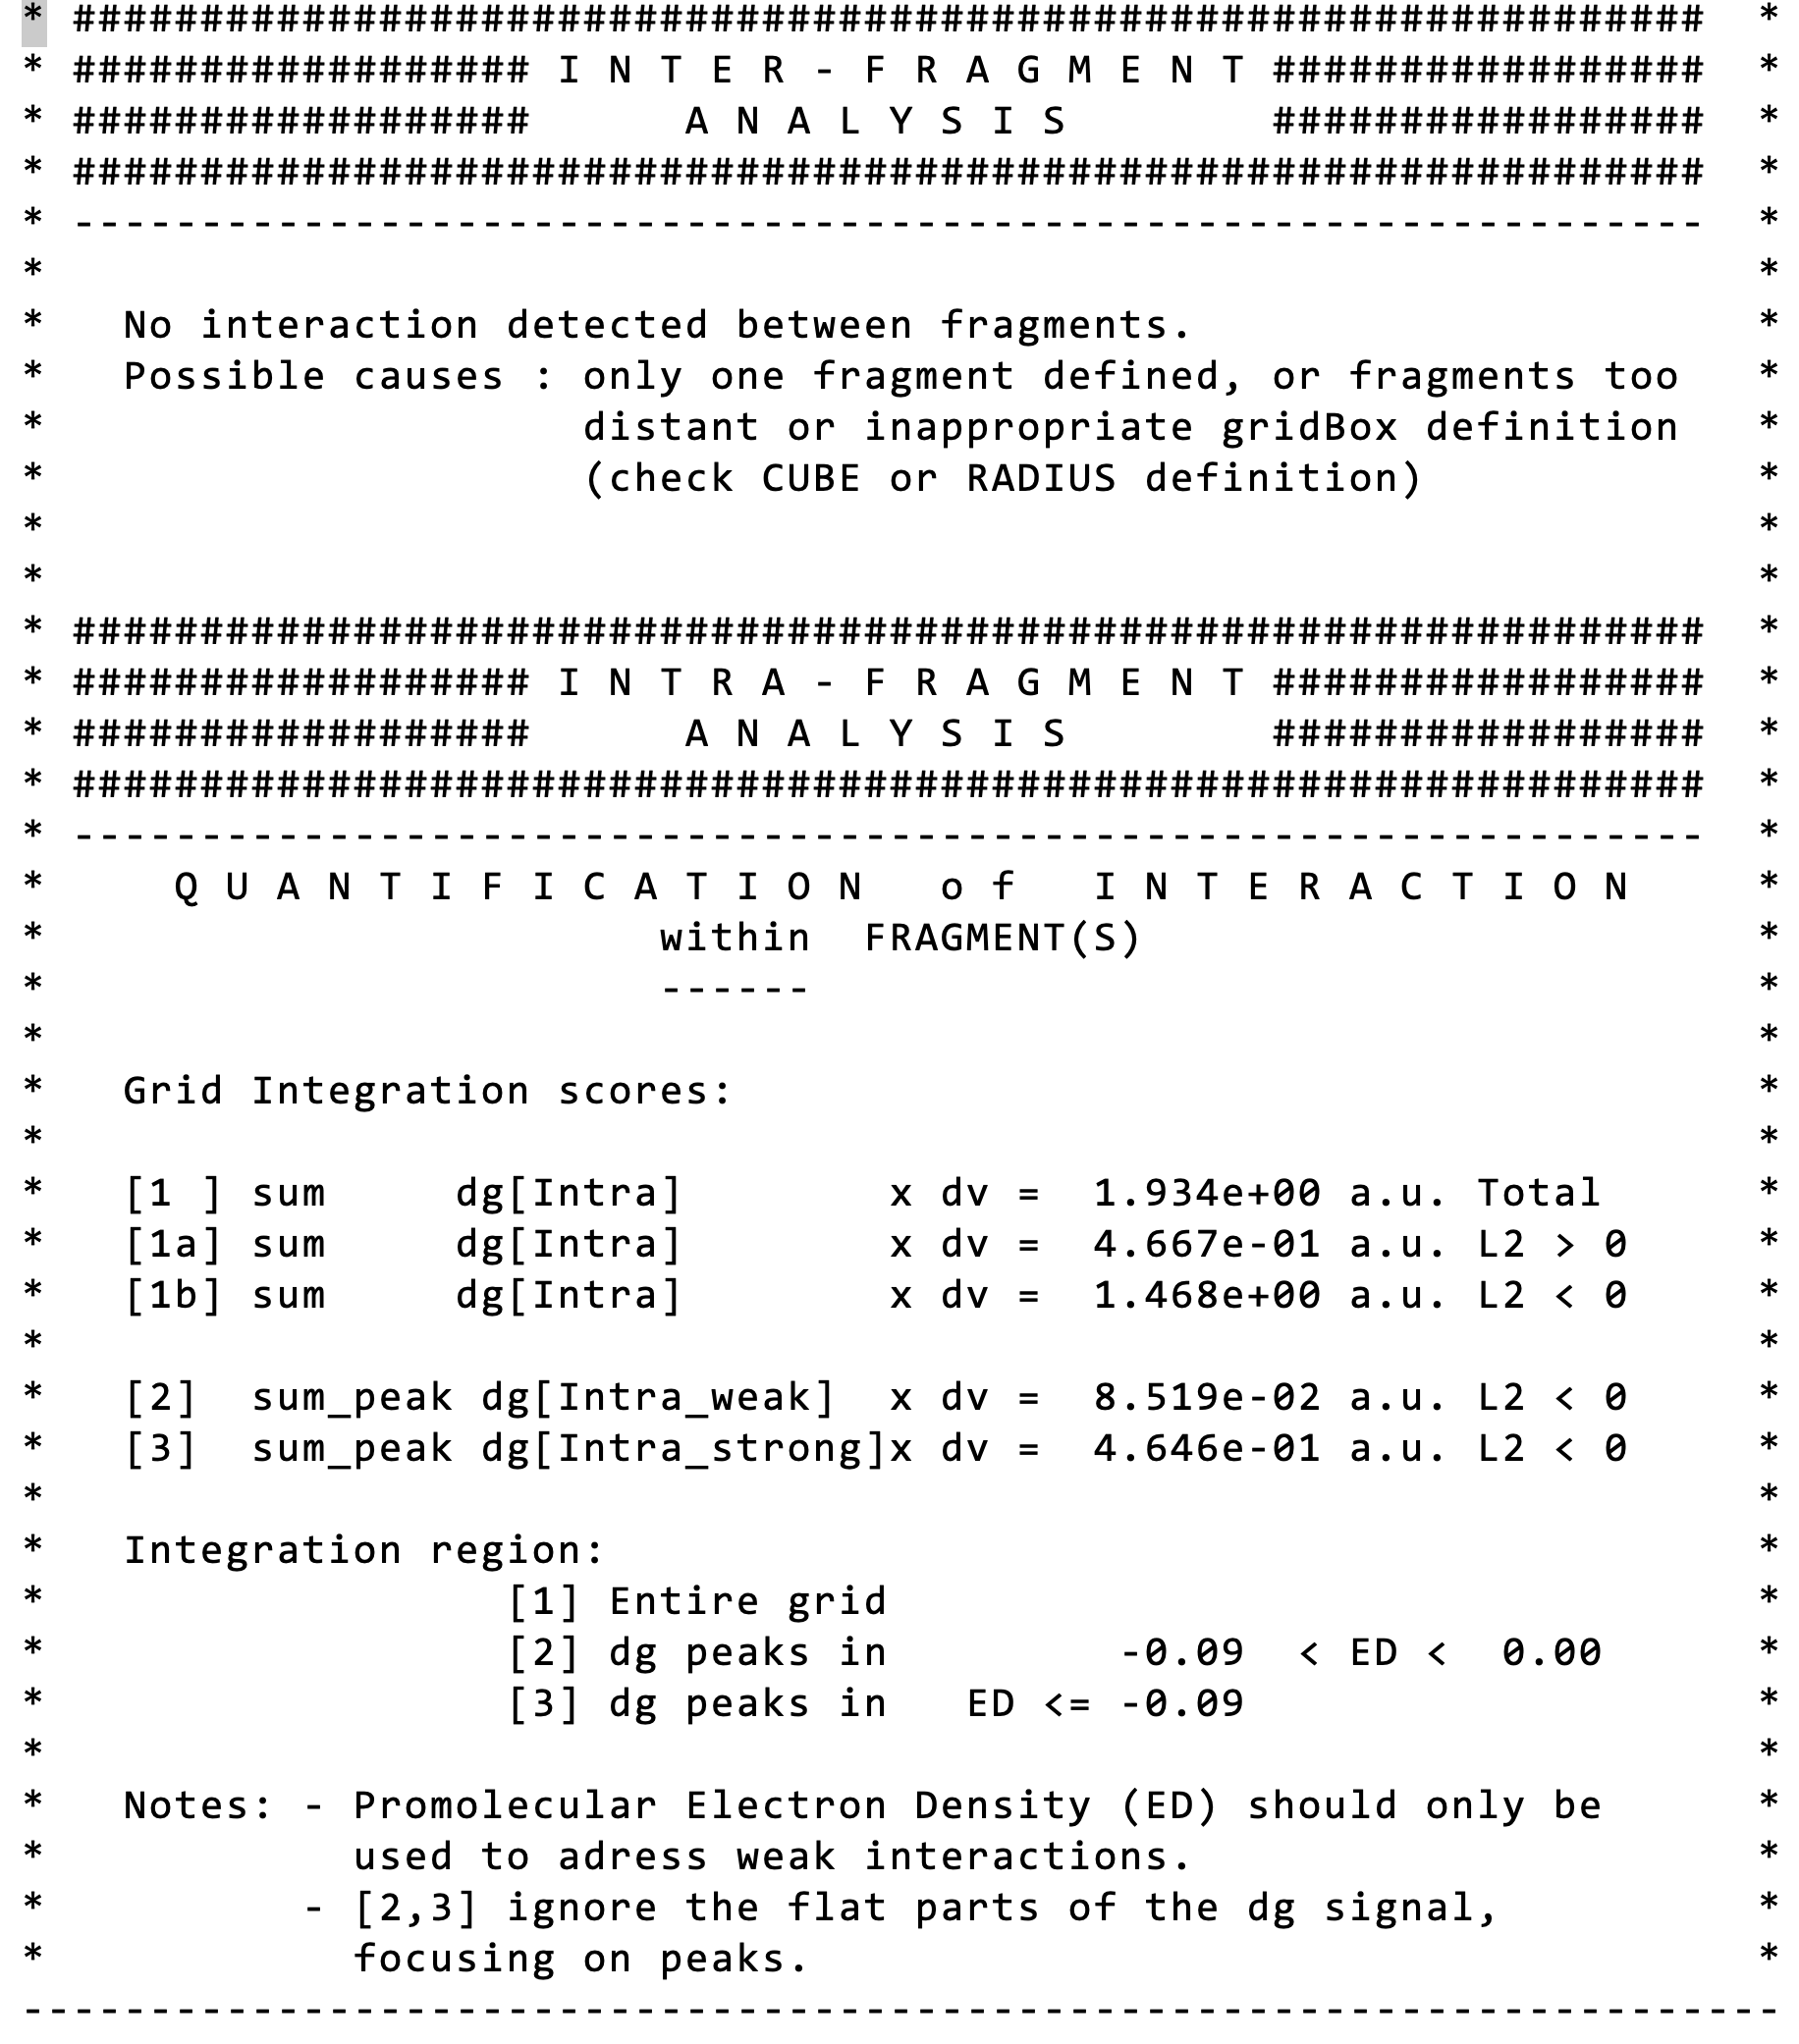
Herafter are described the meanings of the scores given in the output.
The score [1] corresponds to the full integration of δg. Thus, every point in the grid is taken into account, and all the δg values are summed and weighted by the elementary volume dv of each grid cell. The [1a] score is the same as [1] except that only those points of the grid for which λ2 > 0 are considered. The [1b] score is the same as [1] except that only those points of the grid for which λ2 < 0 are considered. Thus, [1] = [1a] + [1b]. The separated scores [1a] and [1b] have been implemented upon user request since the sign of λ2 is used in the original NCI paper by Yang to characterise the kind of interaction in the interatomic regions (bonding situation when λ2 < 0 and non-bonding when λ2 > 0).
Next, the score [2] (similar to [1b]) corresponds to the integration of grid points for which λ2 < 0 and for which the signed electron density rho : -0.09 < ρ < 0.09 and for which qg > 1.3. This score aims at extracting and quantifying only weak interactions in a given 2D-plot signature. Here, IGMPlot detects some weak interactions (H-bonding here) in the whole system (remind that no fragment definition has been supplied, thus, the dimer is considered as one single piece). The latter condition allows to get a score focusing only on the peaks of the 2D-plot fingerprint, removing points of low ED contragradience (the flat part of the signal), making the score [2] more sensitive to the interaction situation. The score [3] is similar to [2] but extracts and quantifies strong (covalent) interactions in a given 2D-plot signature. Note that here, strong interactions are detected in the dimer (the covalent O-H bonds). Of course, the integration of the IGM-δg descriptor cannot be expected to lead as accurate results as QM calculations or IQA, but it offers a fast and robust way to get an order of magnitude of interactions comparing different systems or during their evolution along a reaction.
b) The same dimer considered as formed by two fragments
Change to ../b_2_fragments directory.From the previous mol.xyz coordinate file, two files have been generated and provided: frag1.xyz, frag2.xyz, with the coordinates of each individual water molecule 1 and 2.
Build and save the following param.igm input file:
2
frag1.xyz
frag2.xyz
2D-fingerprint
Note that since the fragment mode has been implicitly employed (by supplying two fragment cartesian coordinate files), IGMPlot automatically separates the inter fragment interactions (δg-inter column 4 in mol-igm.dat), from interactions inside fragments (δ-intra, column 3). Use for instance GNUPLOT to generate the corresponding fingerprints:plot “mol-igm.dat” u 1:3
plot “mol-igm.dat” u 1:4
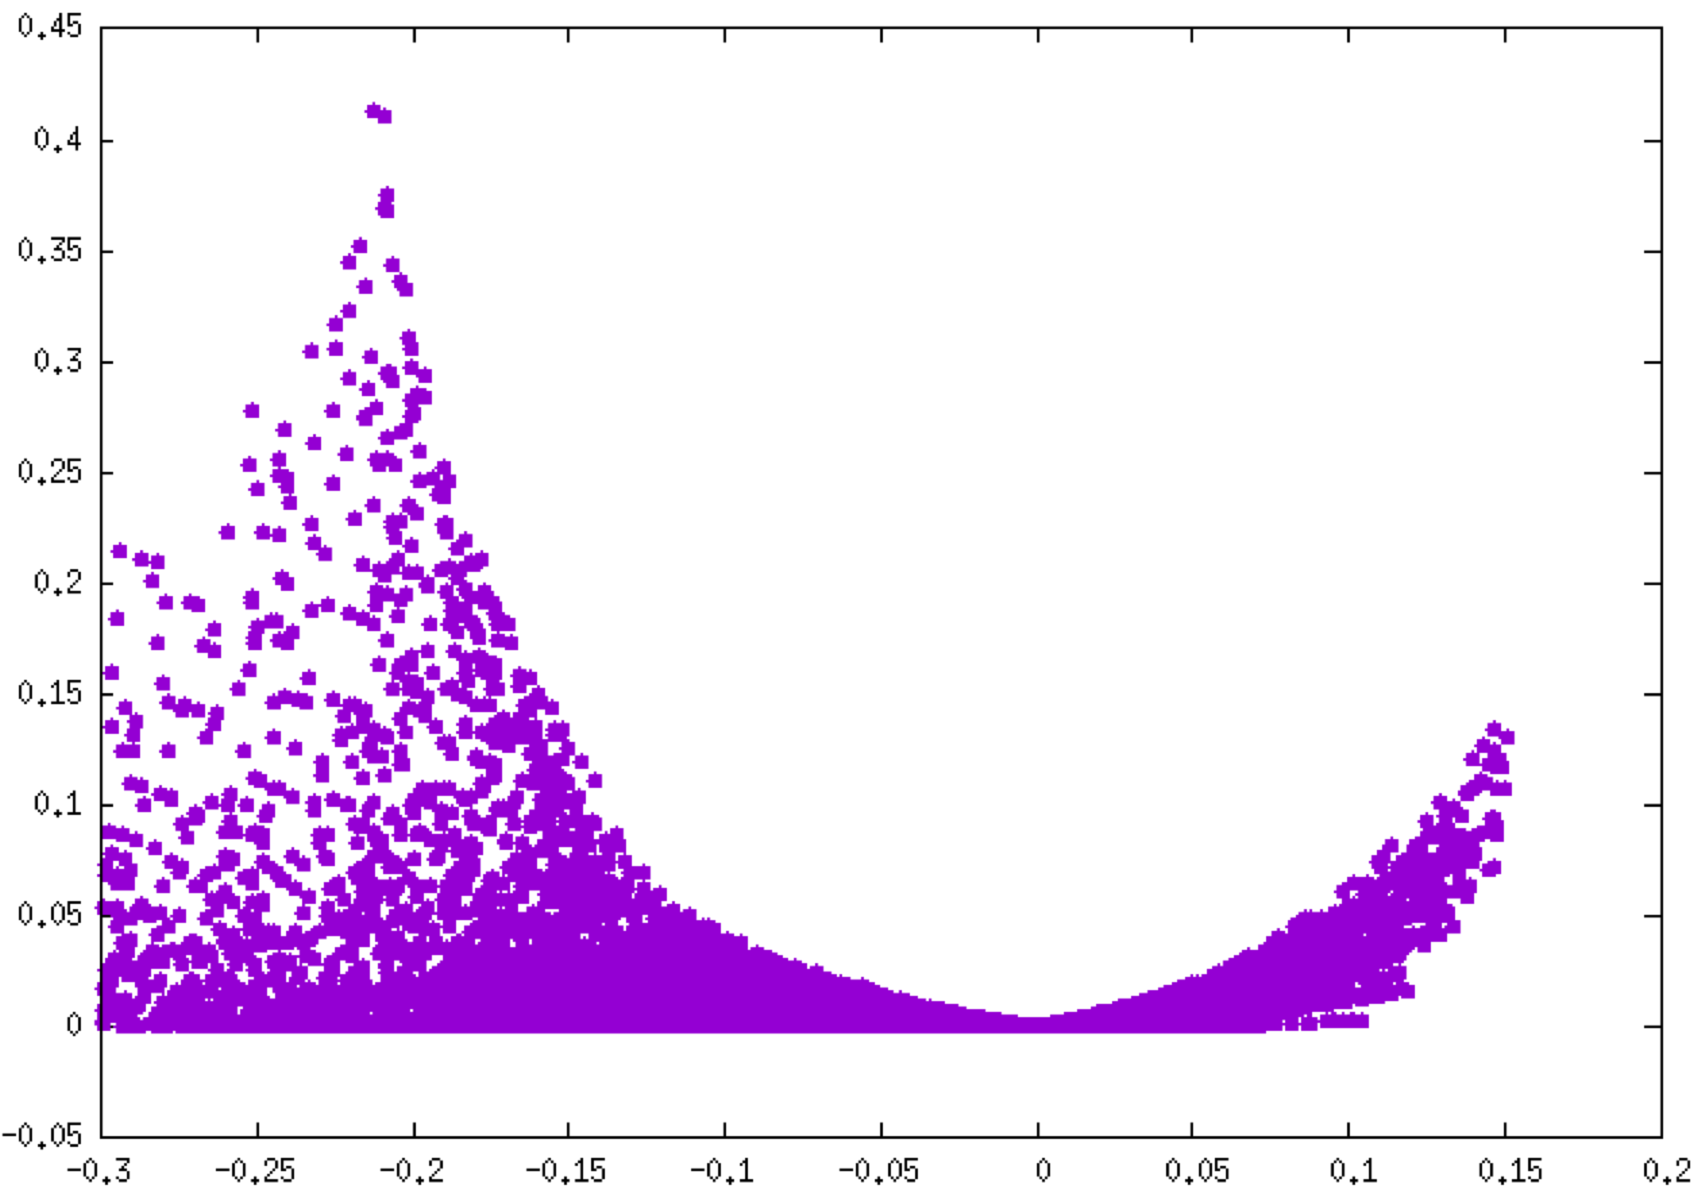
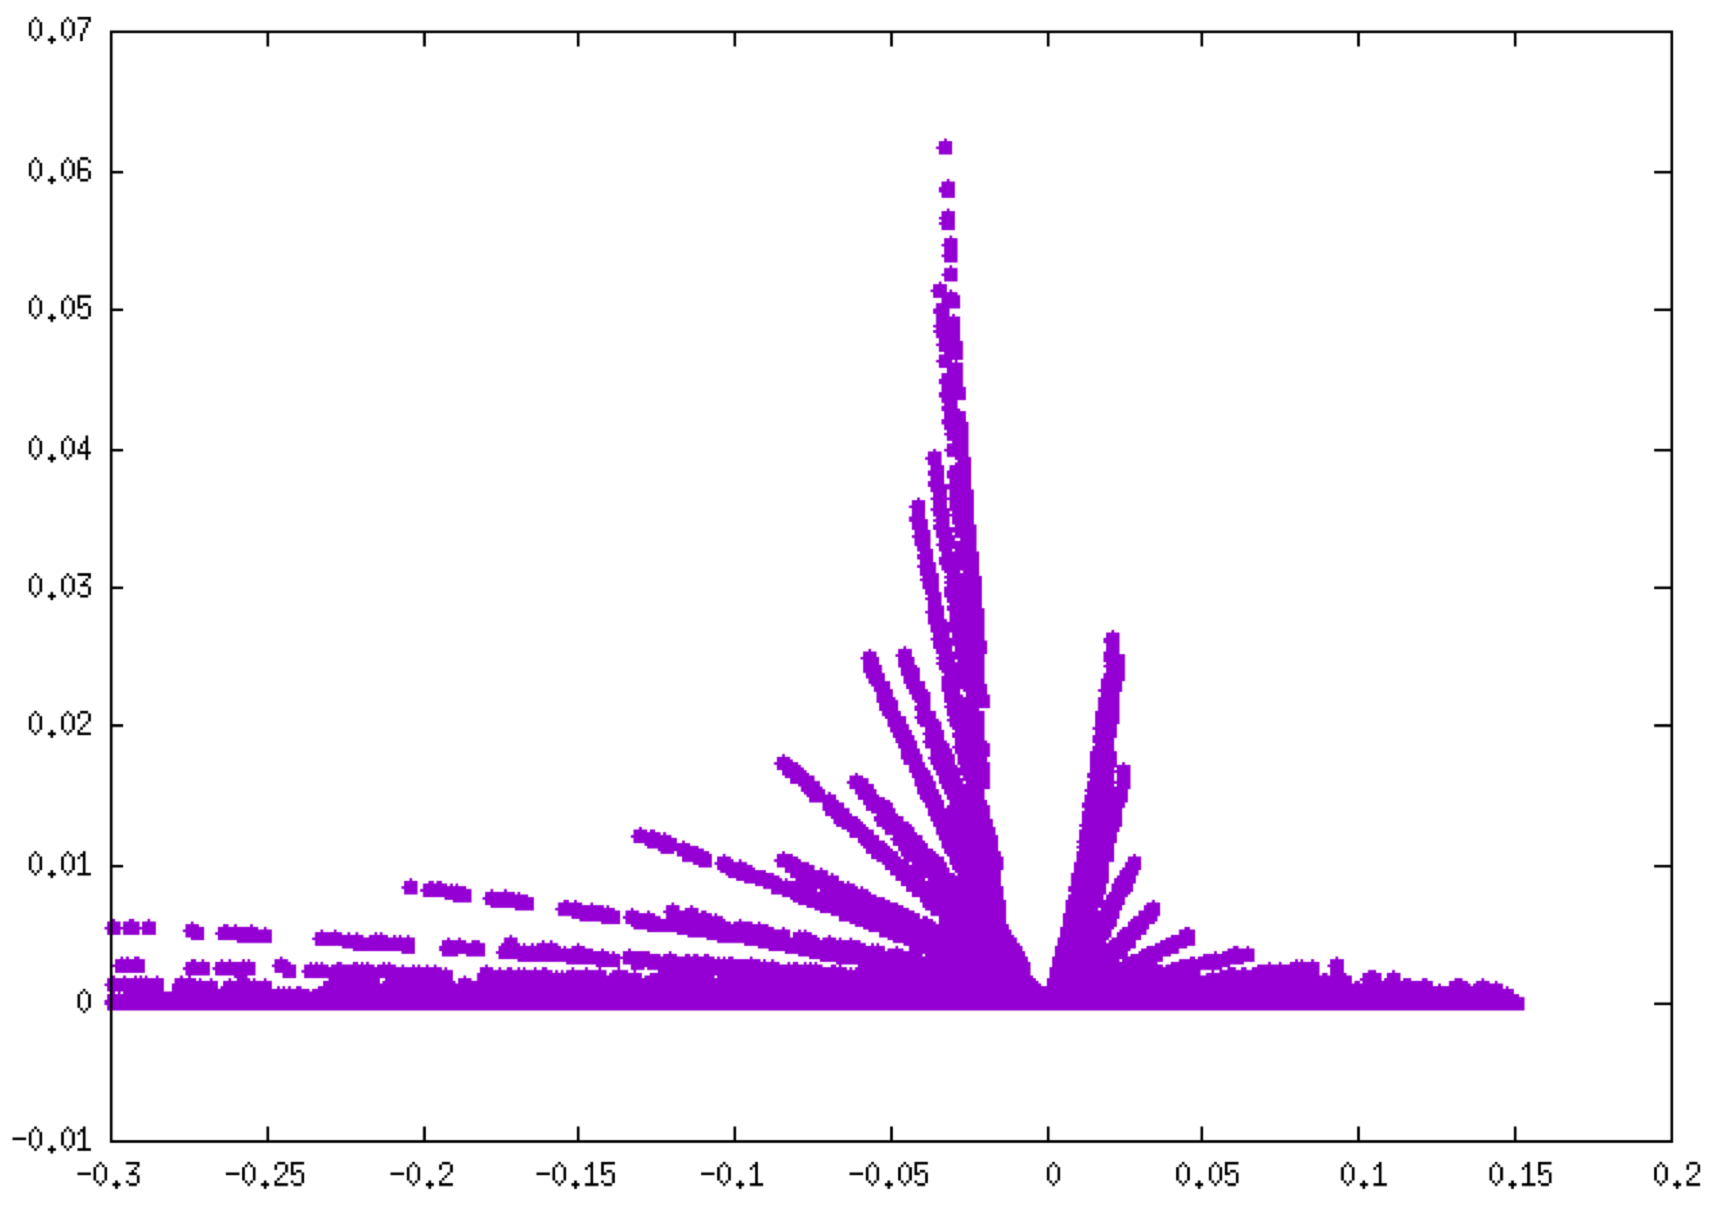
Notice the different peak height scales between these two plots: about 0.4 a.u. for O-H bonding (left, δg-intra), 0.06 a.u. for H-bonding (right, δg-inter). Note that these plots can be coloured according to the qg descriptor value (see above).
There are many advantages to define two fragments whenever it is possible.
♥ To get a larger resolution, increase the grid increment by using the INCREMENTS keyword in param.igm:
2
frag1.xyz
frag2.xyz
INCREMENTS 0.07 0.07 0.07
3D-isosurfaces
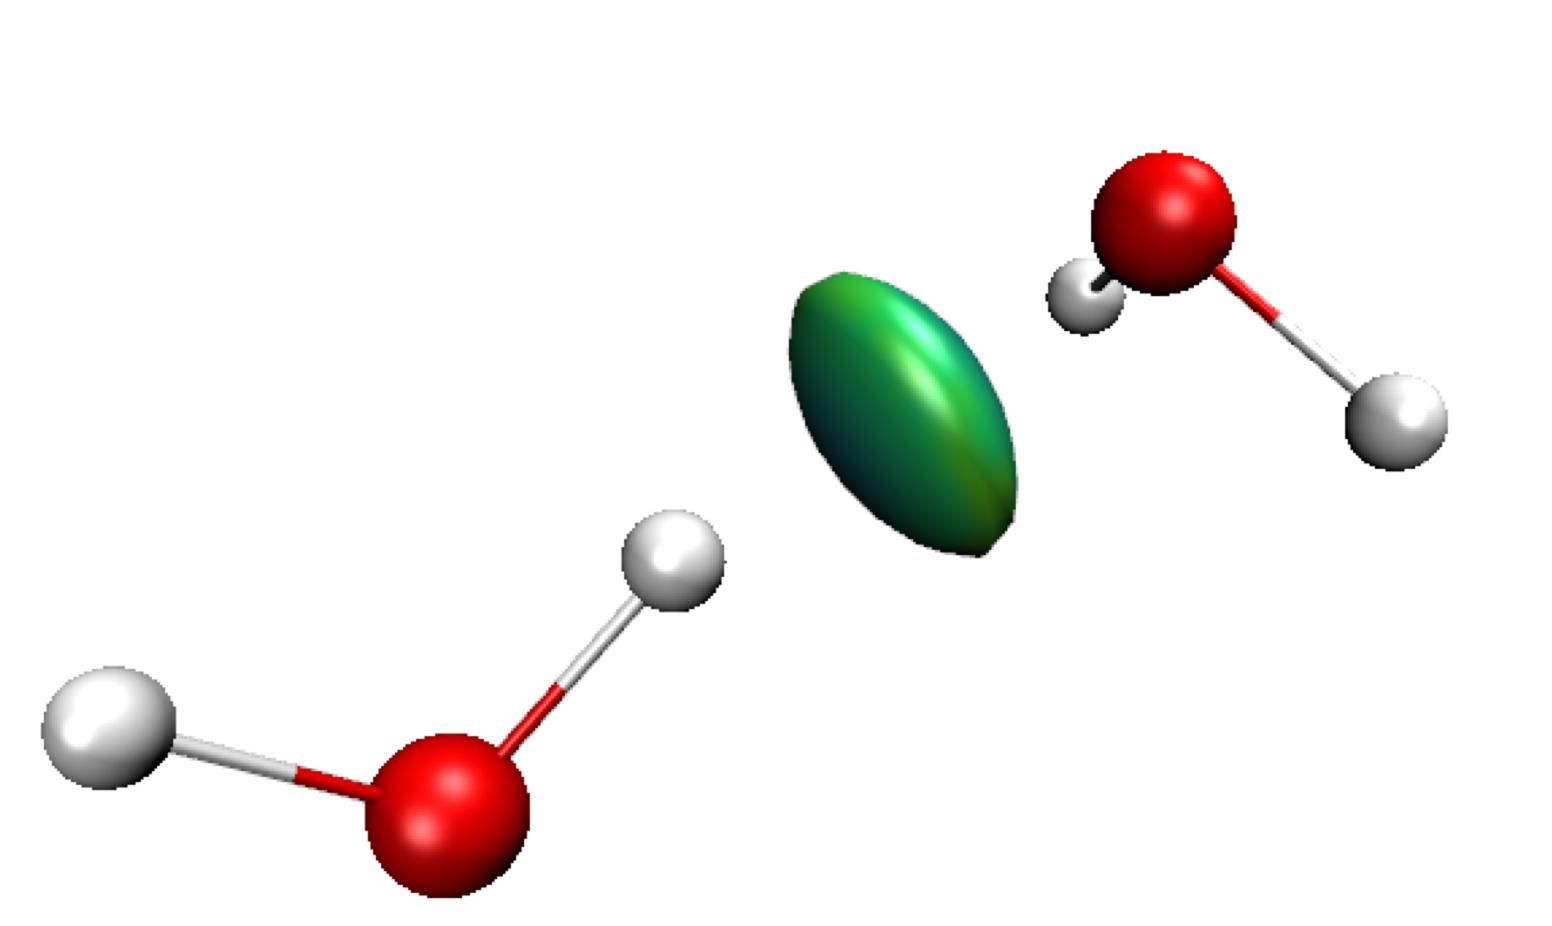
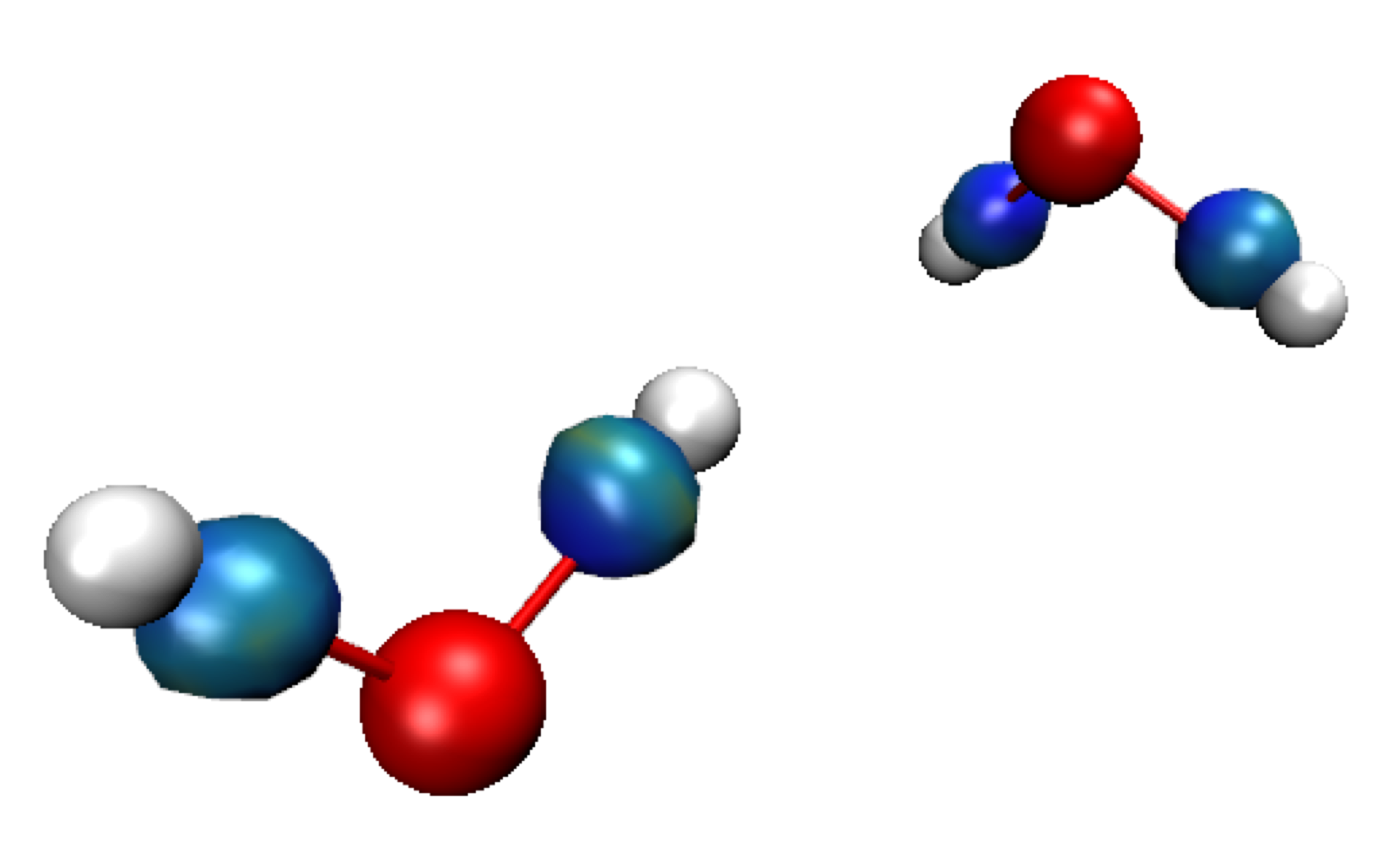
Exit GNUPLOT. Run VMD and load the igm.vmd session file.Default res-dgInter.cube Molecule is displayed in this vmd session. It represents the region of interaction between the two fragments: where H-bonding takes place here (δg-inter descriptor, on the left in the Figure below). Since two fragments have been defined here, we only see the regions of interaction between these two fragments in this res-dgInter.cube “Molecule” in VMD. Switch to the δg-intra representations to see the interactions inside fragments (Double-click on the “D” button in the VMD Main panel). Now, we clearly see iso-surfaces located between covalently bonded atoms (on the right on the Figure below).
IGM interaction quantification
Quit VMD. Edit the igm.log file.Note that the “fragmentation scheme” has been used. Now, two sections appear, the first one (INTER) corresponding to the isolated hydrogen-bond between water molecules:
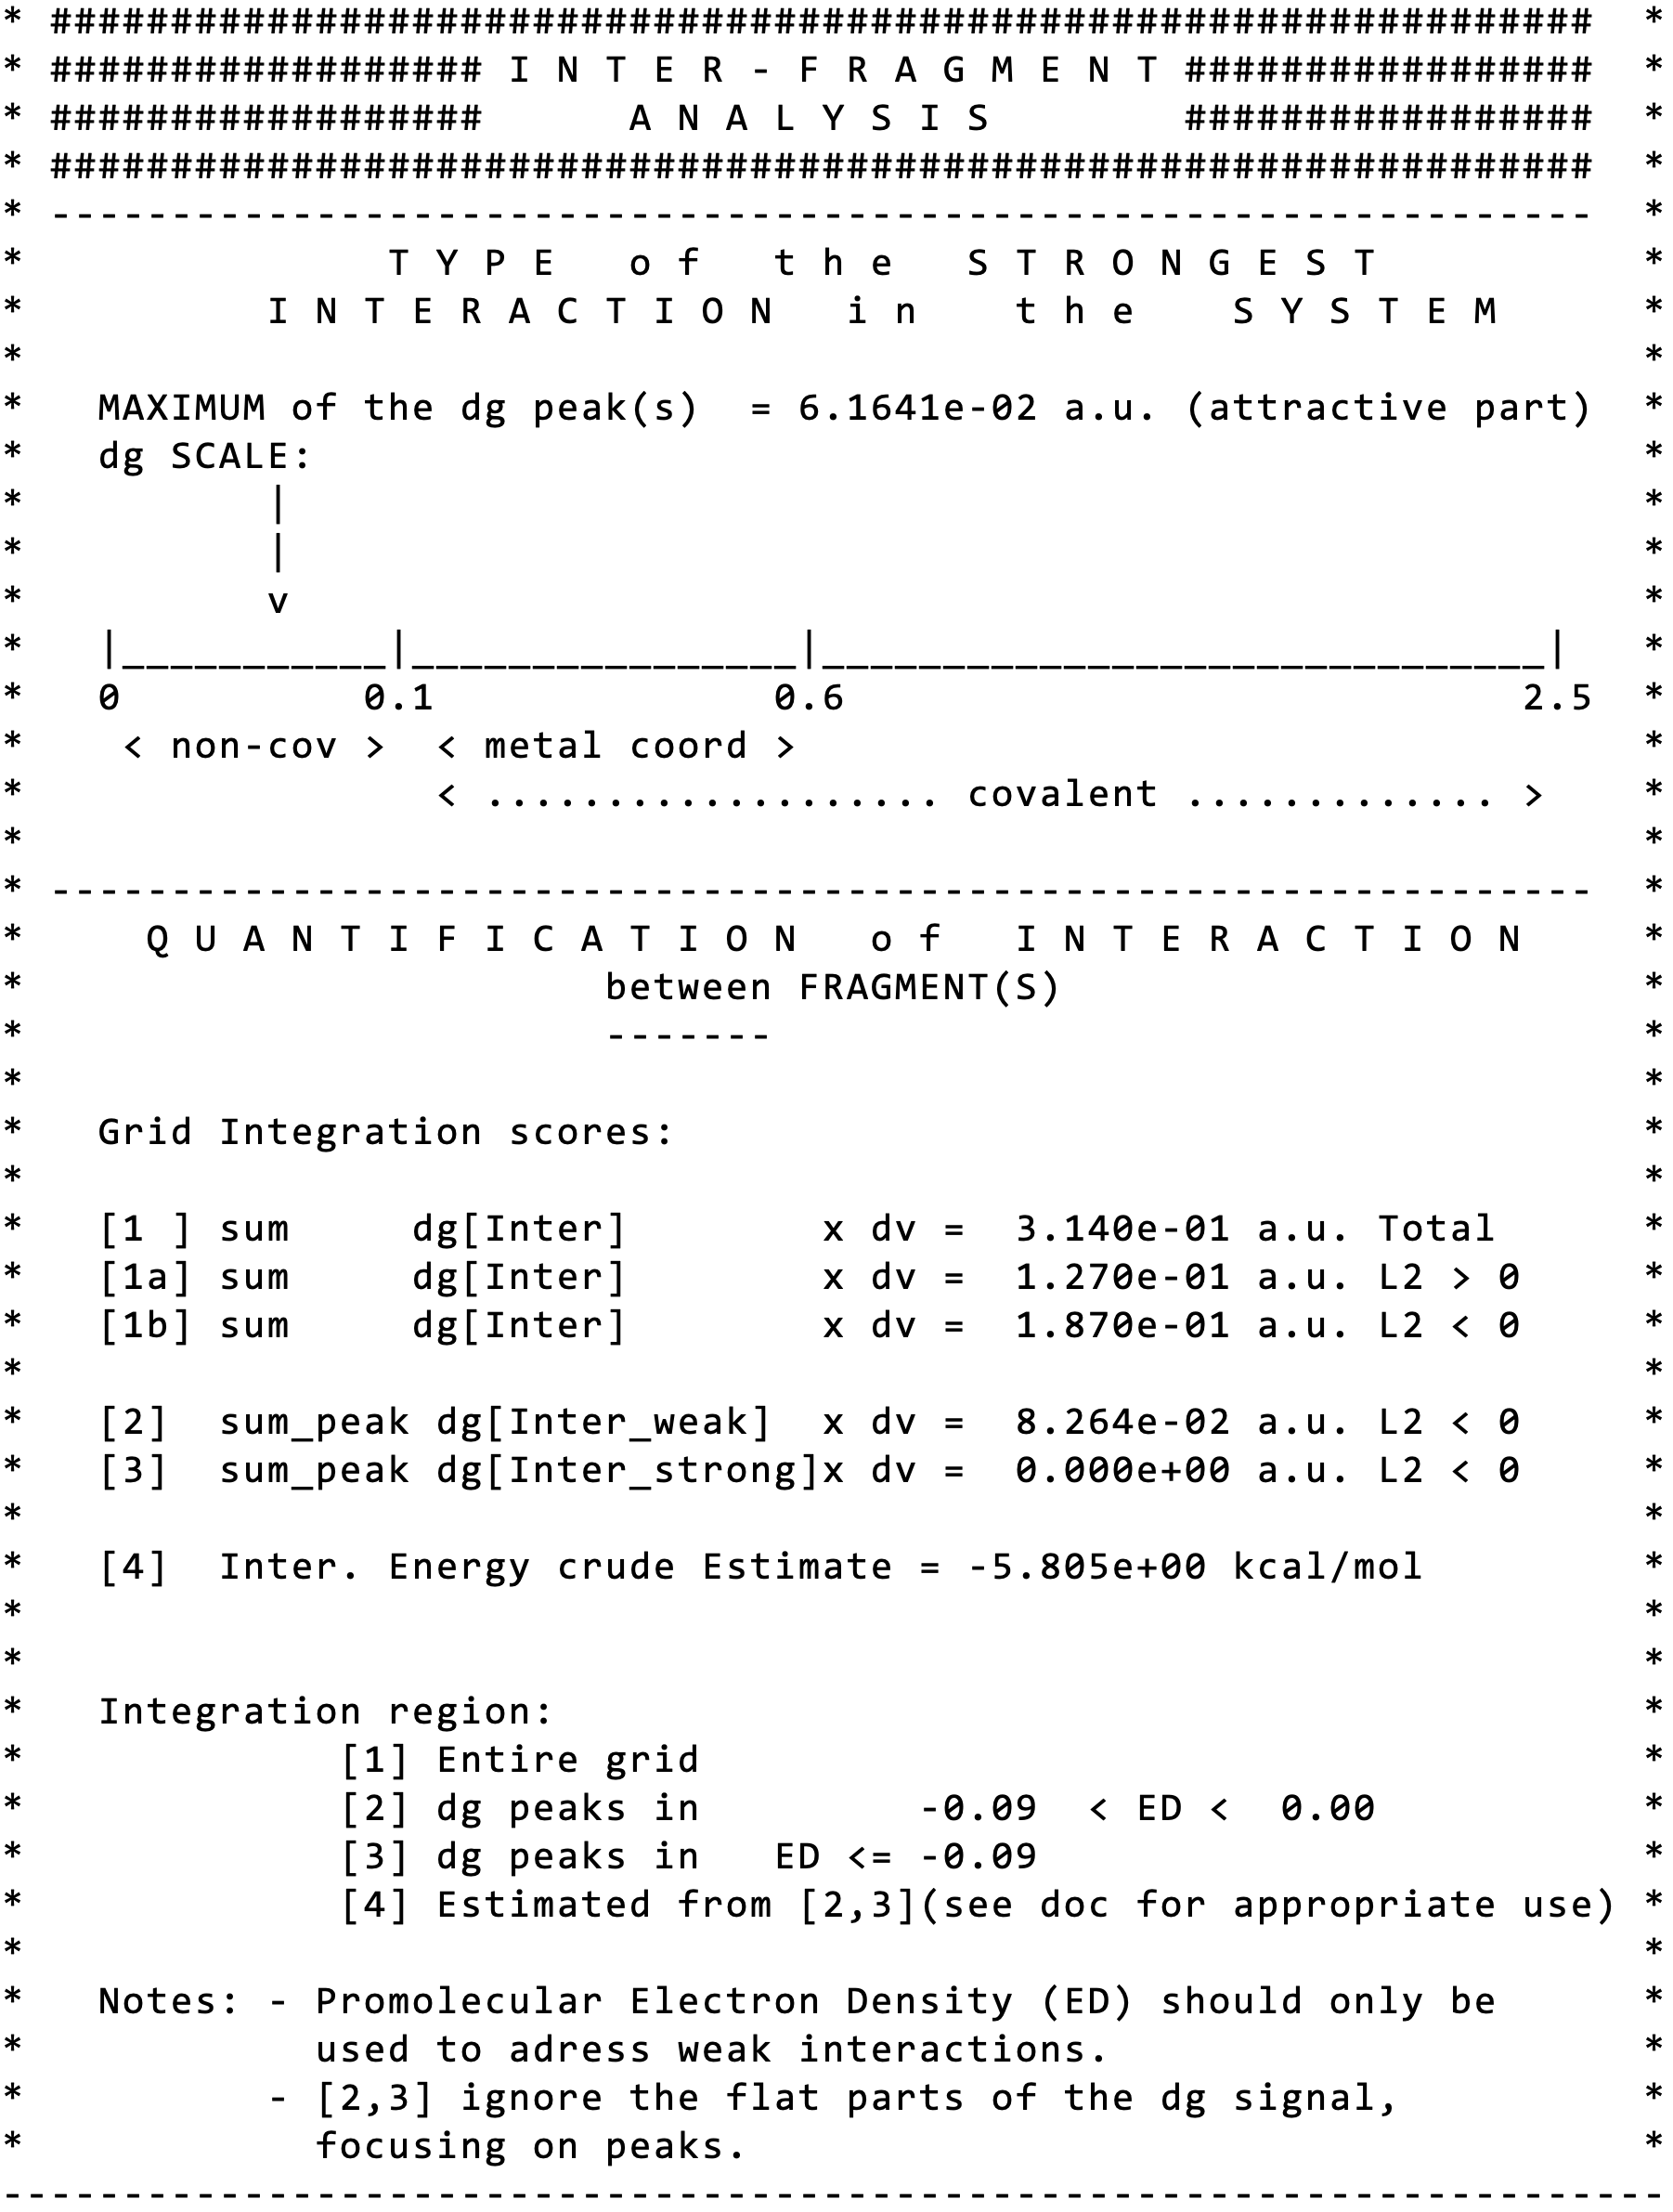
Note immediately that IGMPlot has detected the MAXIMUM of the δg peak(s) = 6.1641e-02 a.u”, classifying this interaction in the “non-cov” domain on the indicative IGM peak scale.
Note that the score[3] (=0) indicates that there is no strong interactions between the two considered fragments.
The score [4] is the result of an attempt to establish a relationship between the integrated δg and the stabilization energy assessed at the quantum mechanical level of theory.
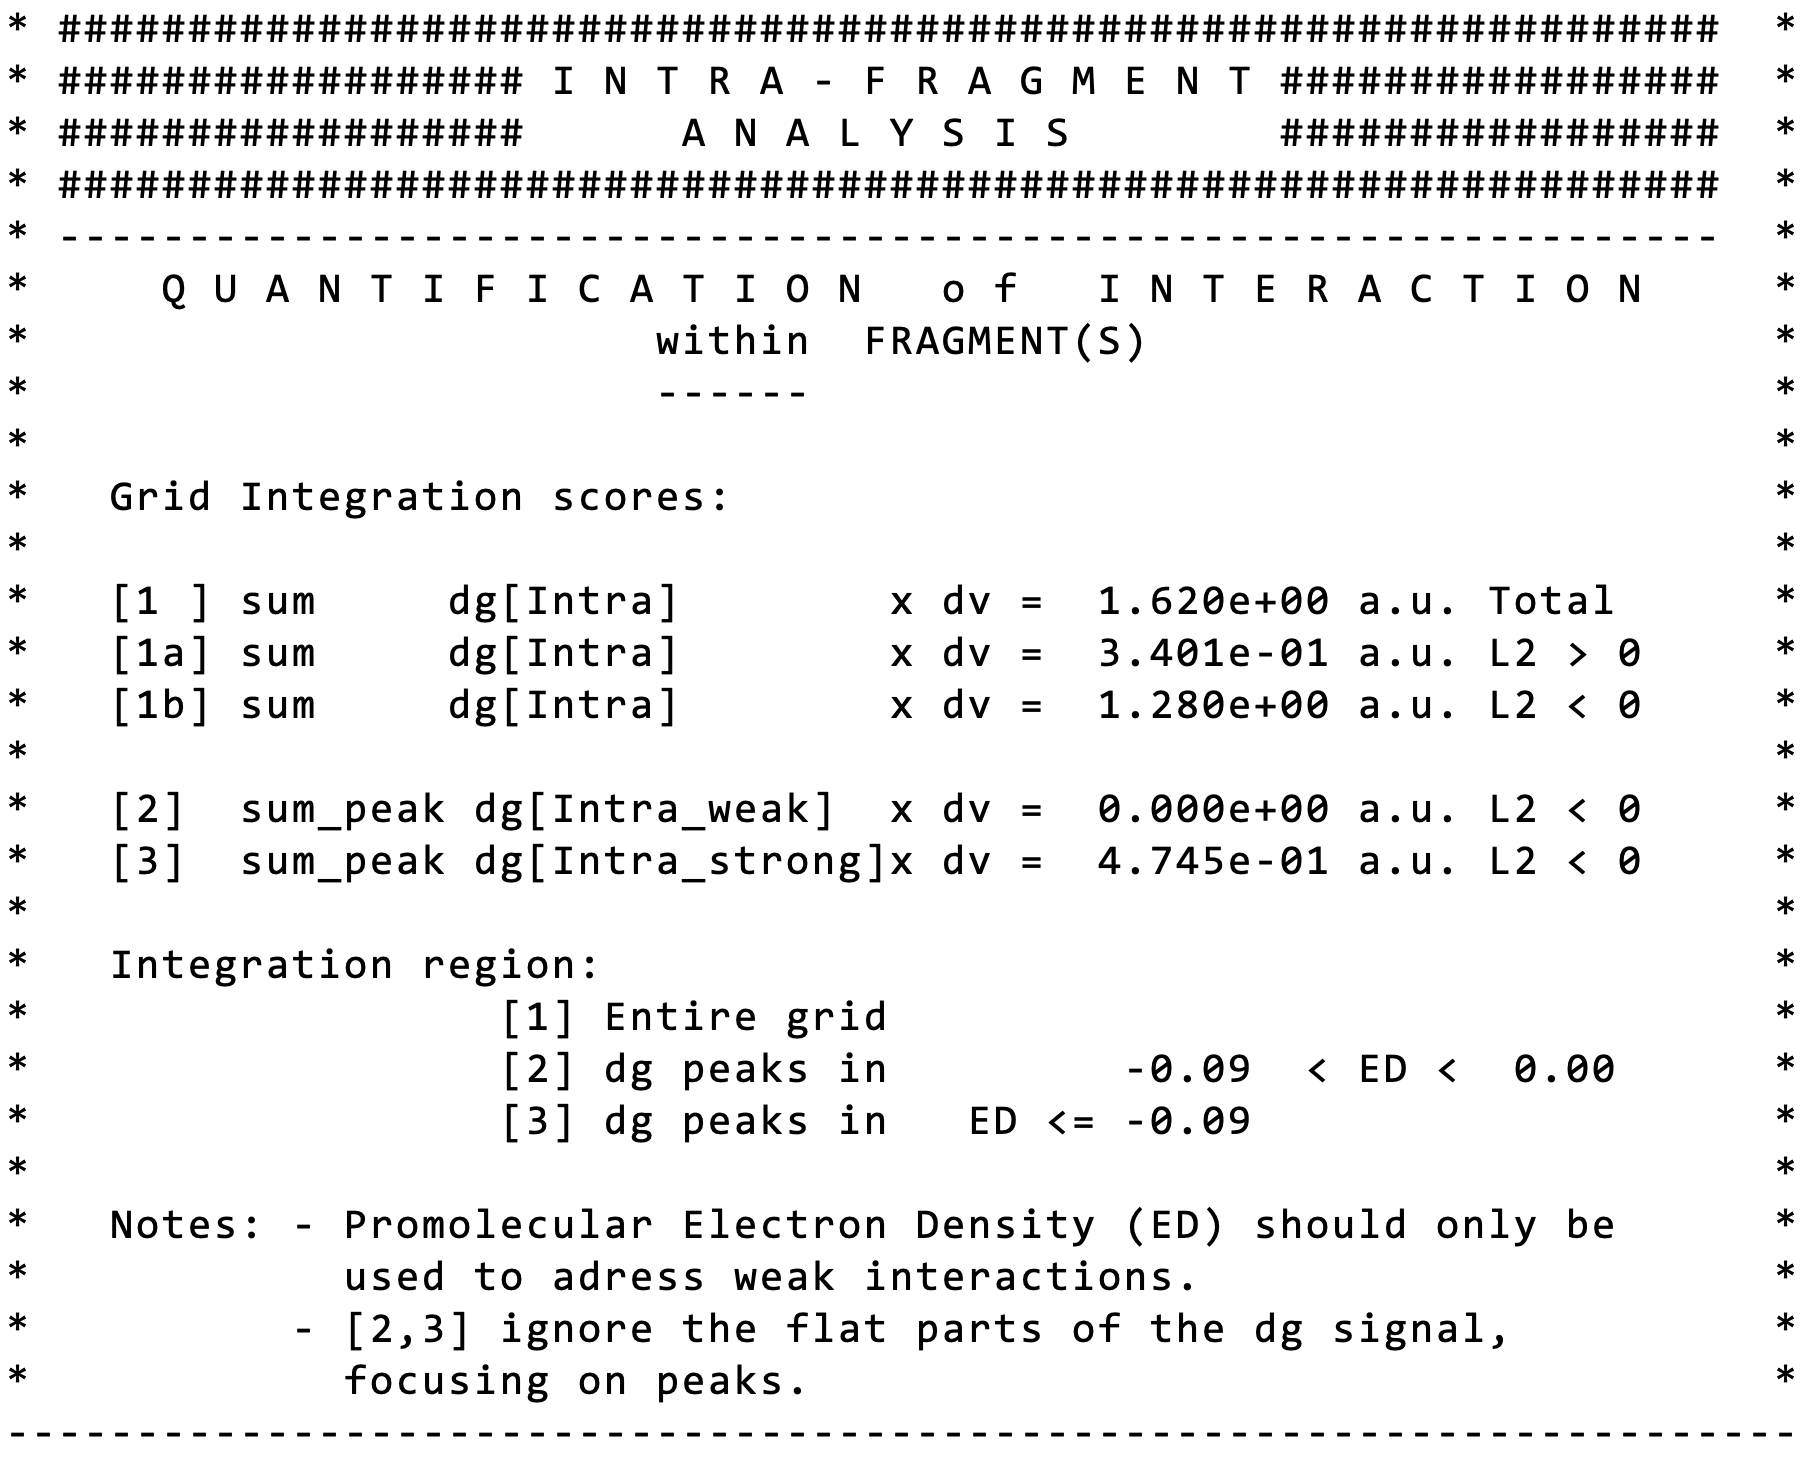
A second section "INTRA" is present here, concerning the interactions detected inside each fragment. Note that the score[2] (=0) indicates that there is no weak interactions inside the considered fragments. Here, only covalent bonding is detected: the O-H bonds.
2) Quantum Mechanical (QM) mode
Change directory to folder ../../2_waterDimerQM of the supplied material.In this section we are going to use a QM description of the electron density (ED), instead of the promoelcular model of the ED employed in the previous examples. IGMPlot will use a wave function input file to reconstruct the ED. This wave function file is supplied (mol.wfx).
a) Dimer considered as one single block
Go to directory a_singleFragmentBuild and save the following param.igm input file (the file param.igm must be located in the same directory as mol.wfx supplied for you):
1
mol.wfx
Run the program with the command in a linux terminal: -> IGMPLOT param.igm > igm.log &
2D-fingerprint
Since the system is considered as a whole piece here, the δg=f(ED) interaction fingerprint is expected to reveal two peaks on the same plot: one for the O-H covalent bond and one small for hydrogen-bonding.Instead of simply visualizing the interaction 2D-fingerprint assessed at the QM level of theory using GNUPLOT, we are going to compare on the same plot the δg QM interaction signature of the dimer to the one previously obtained at the promolecular level of theory by plotting the two corresponding signatures on the same plot:
plot "mol-igm.dat" u 1:3 title "QM" pt 7, "../../1_waterDimerPromol/a_singleFragment/out-igm.dat" u 1:3 title "PRO" pt 7
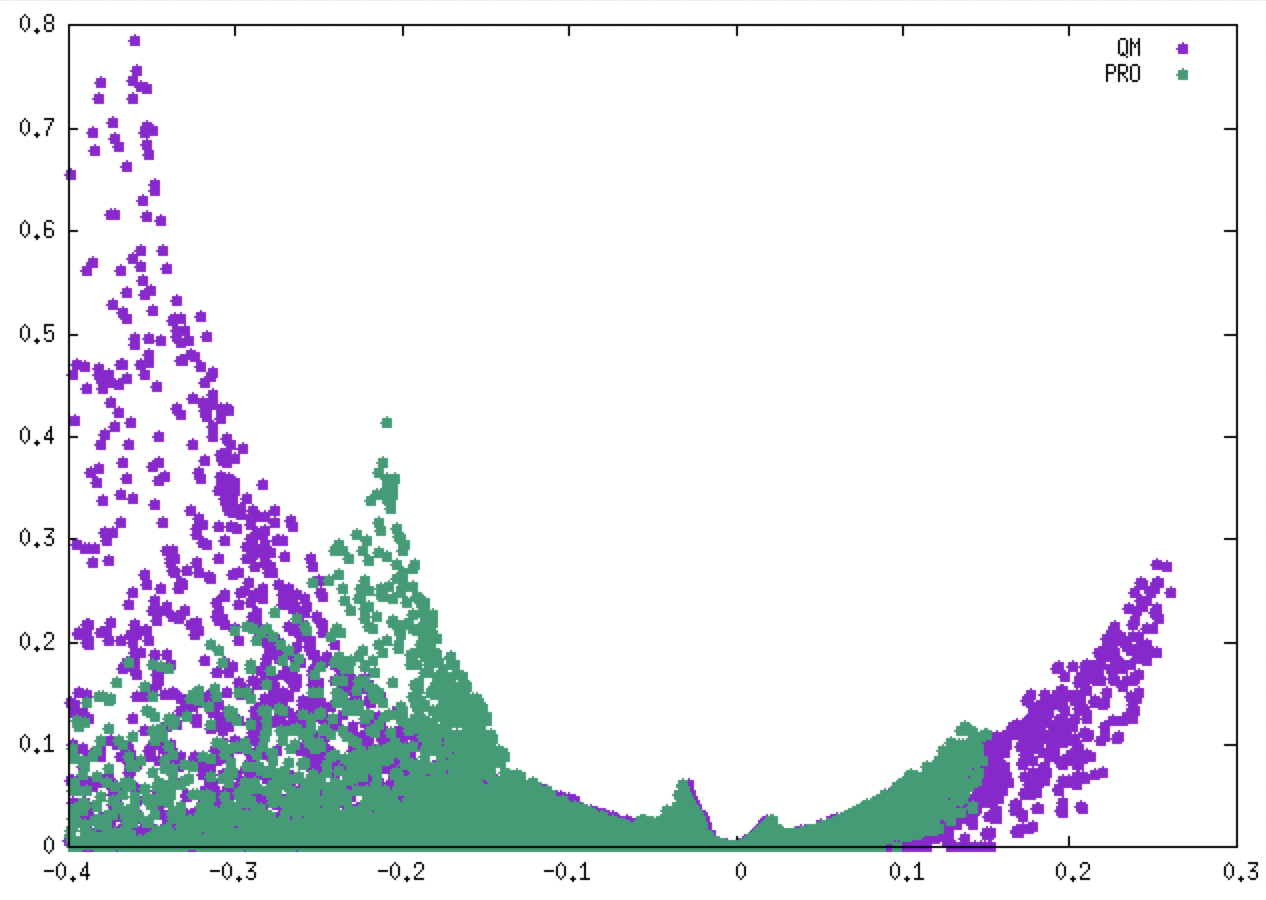
(QM = purple, PRO = green).
As illustrated in the above figure, employing relaxed QM ED (purple) considerably shifts the covalent peak to larger ED and δg values, while both non-covalent signatures almost superimpose (QM/PROMOL). That is the reason why studying interactions in the strong domain of ED requires the use of ED relaxed by means of QM calculations.
Conversely, we can see that the interaction signatures (PRO/QM) in the weak domain of the ED are very similar.
3D-isosurfaces
We are now going to observe the regions of space where interactions detected at the QM level take place. Once more, a large difference is observed between PROMOLECULAR and QM ED. The shape of the isosurfaces in the covalent regions is more elongated in the case of QM ED, rather than spherical in the case of promolecular ED (see previous Figure):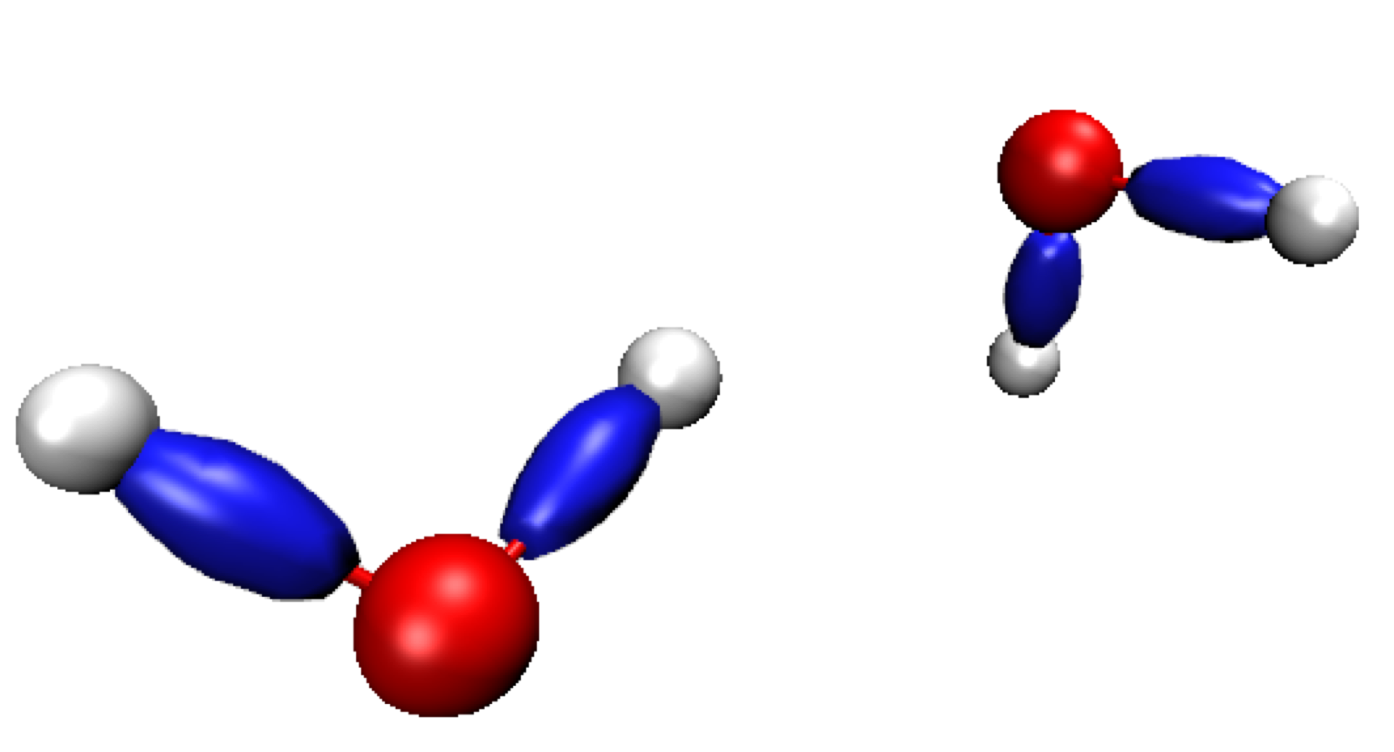
This elongated shape reveals strong covalent features in the interaction.
The figure above has been obtained with the default isovalue chosen by IGMPlot (40% of the value of the maximum δg peak detected in the 2D-fingerprint). But, if you decide to lower this isovalue down to 0.04, you will observe the formation of a new envelop in between the two water molecules, disc-shaped, as previously oberved at the promolecular ED level using two fragments. This "hydrogen-bond" isosurface is very very similar to the one obtained at the promolecular level. This is because in the lowd ED domain, the ED obtained either at the QM or promolecular level has similar features. Unfortunately, lowering the isovalue generates very bulky covalent envelops. This drawback can be suppressed by defining two fragments, as shown below. That is the whole point of the IGM tool: to carry out an uncoupling scheme automatically separating intermolecular and intramolecular interactions.
IGM interaction quantification
Edit the igm.log file.Additional information is given in the igm.log file on the wave function used (primitive number).
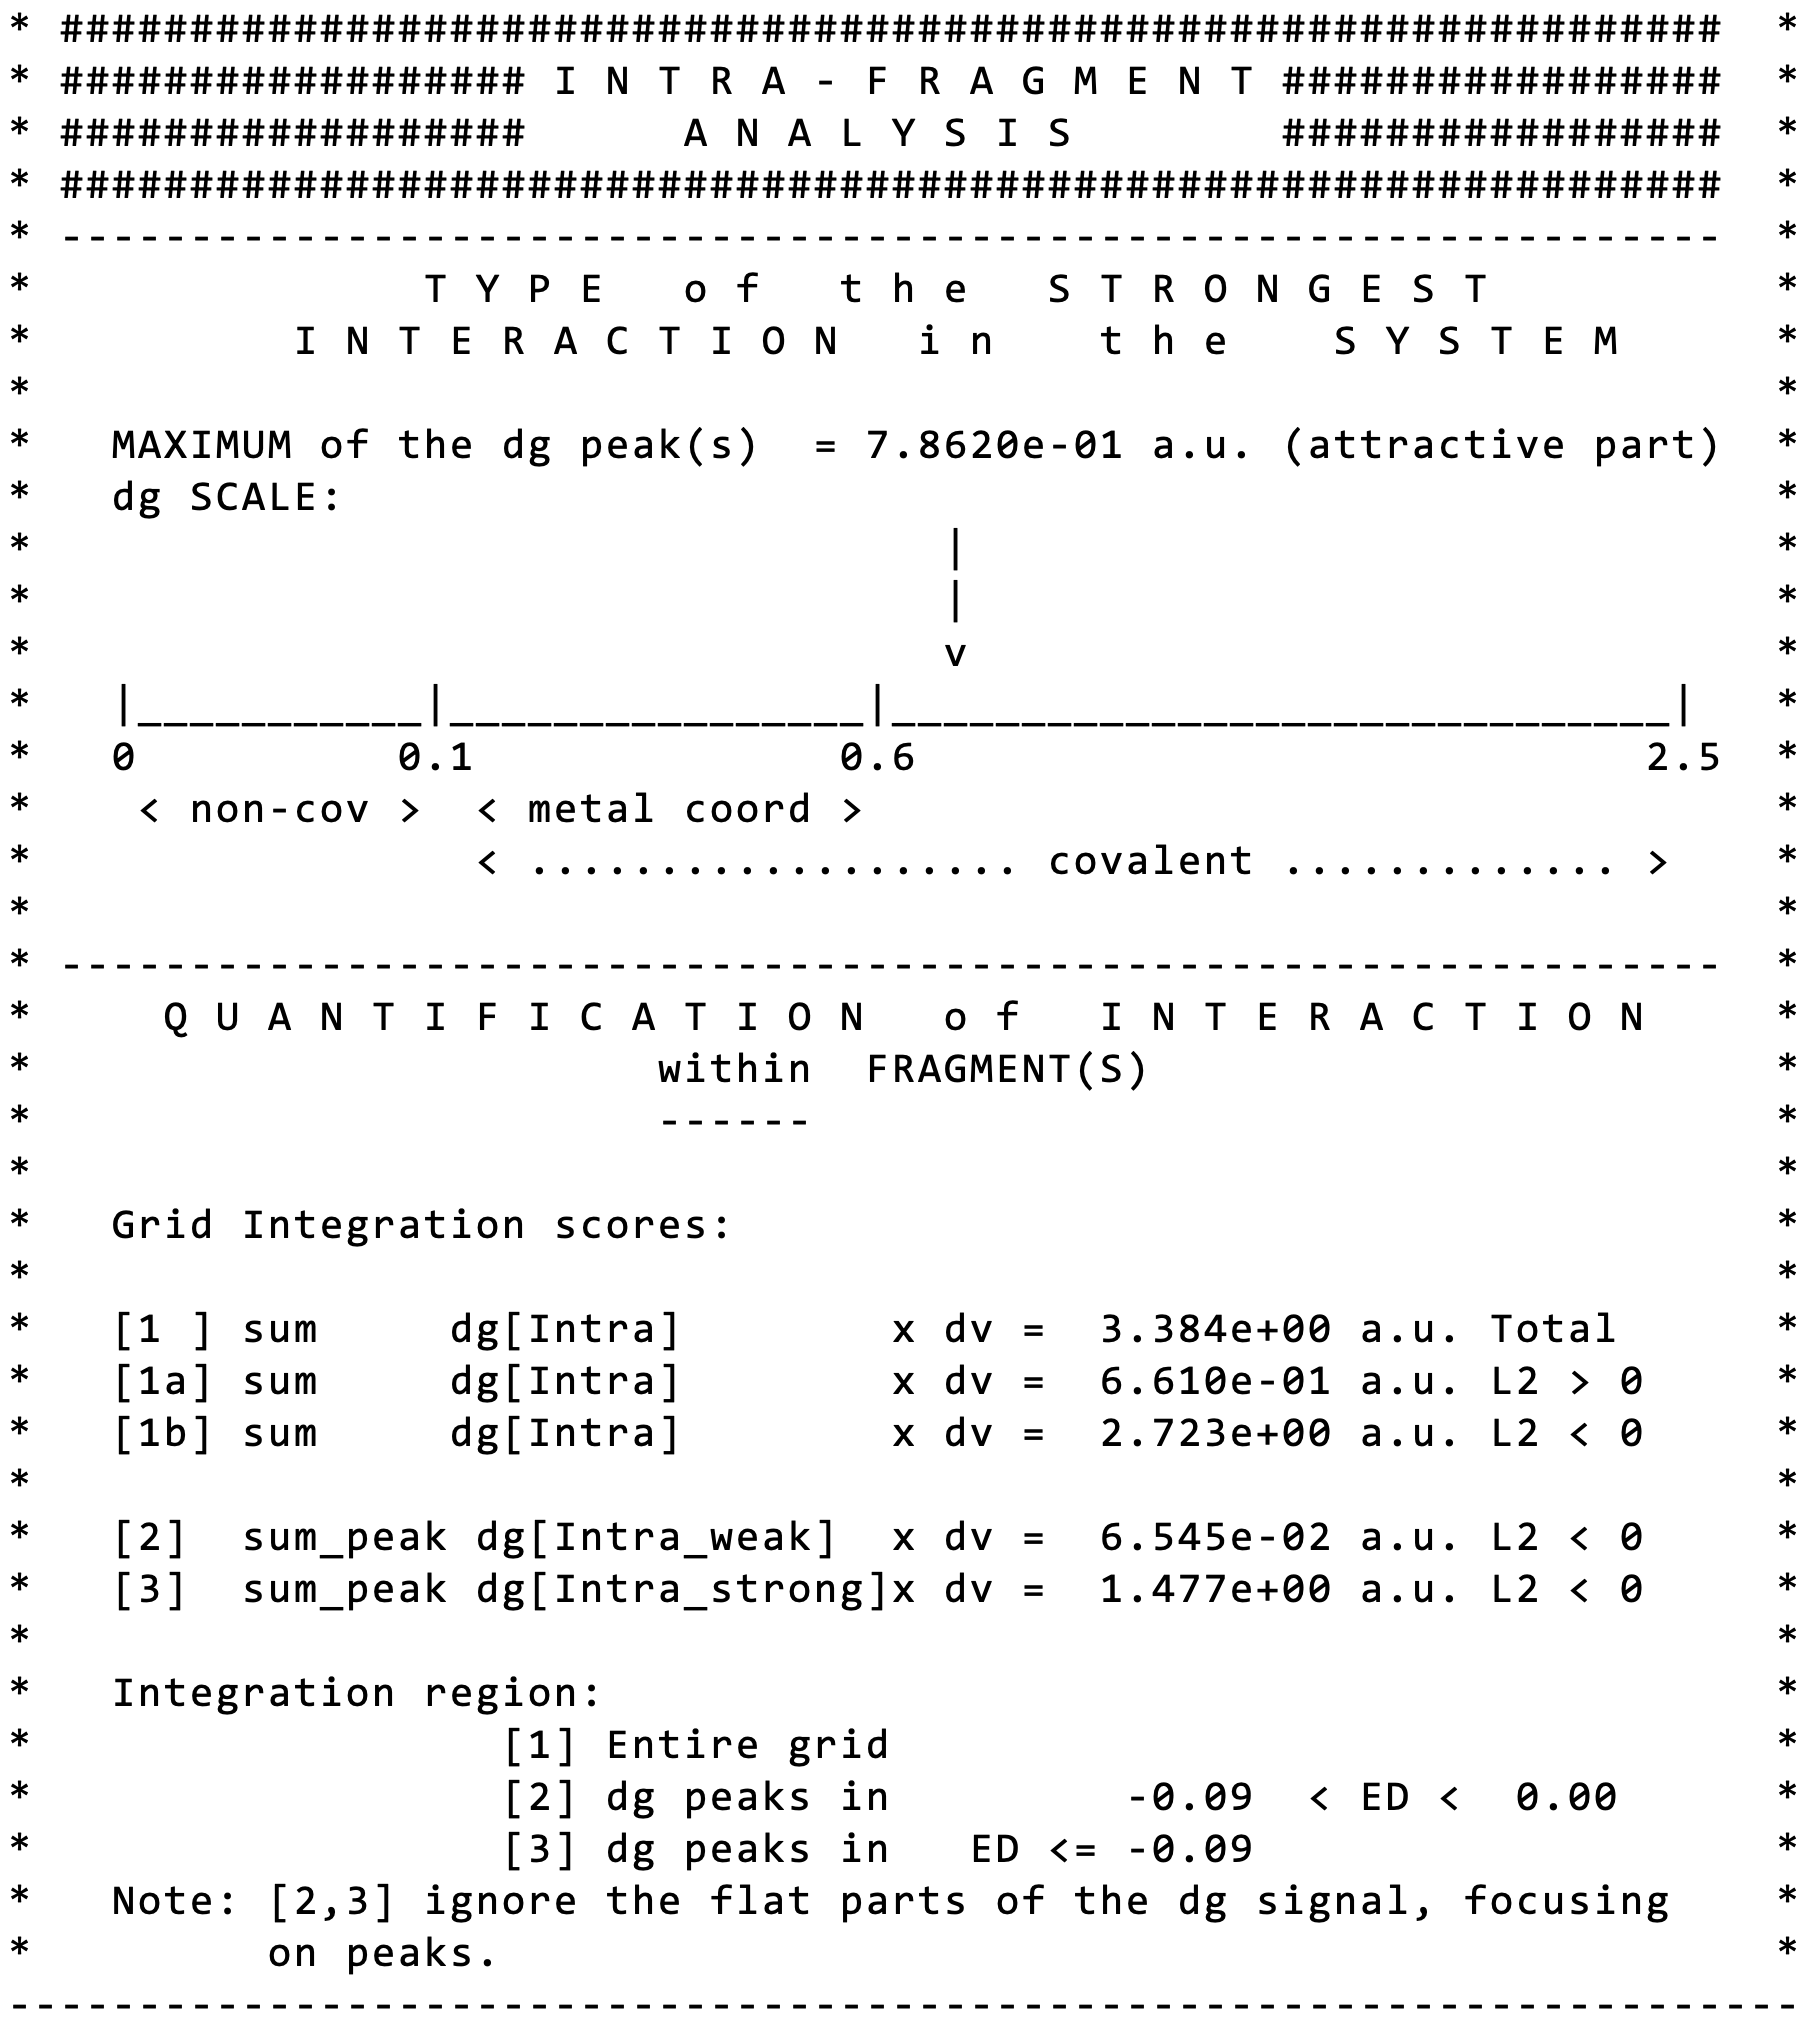
Note that IGMPlot classifies the strongest interaction detected in this signature as beeing covalent (see the arrow pointing on the δg scale beyond 0.6).
In other respects, IGMPlot also detects the presence of weak interactions in this system (see score [2]).
b) Dimer considered as formed by two fragments
Go to directory ../b_2_fragments/Build and save the following param.igm input file:
1
mol.wfx
FRAG1 1-3;
Note that since the FRAG2 keyword was not employed to define the second fragment, default is to consider that the second fragment is made by the rest of atoms, in other words: FRAG1 + FRAG2 = the whole system in that case. But, one could define FRAG1 and FRAG2 such that FRAG1+FRAG2 describes a subset of the whole system.
Run the IGMPlot program with the command in a linux terminal: -> IGMPLOT param.igm > igm.log &
Plot the intra and inter signature on the same plot using GNUPLOT:
plot "mol-igm.dat" u 1:3 title "QM_intra" pt 7, "mol-igm.dat" u 1:4 title "QM_inter" pt 7
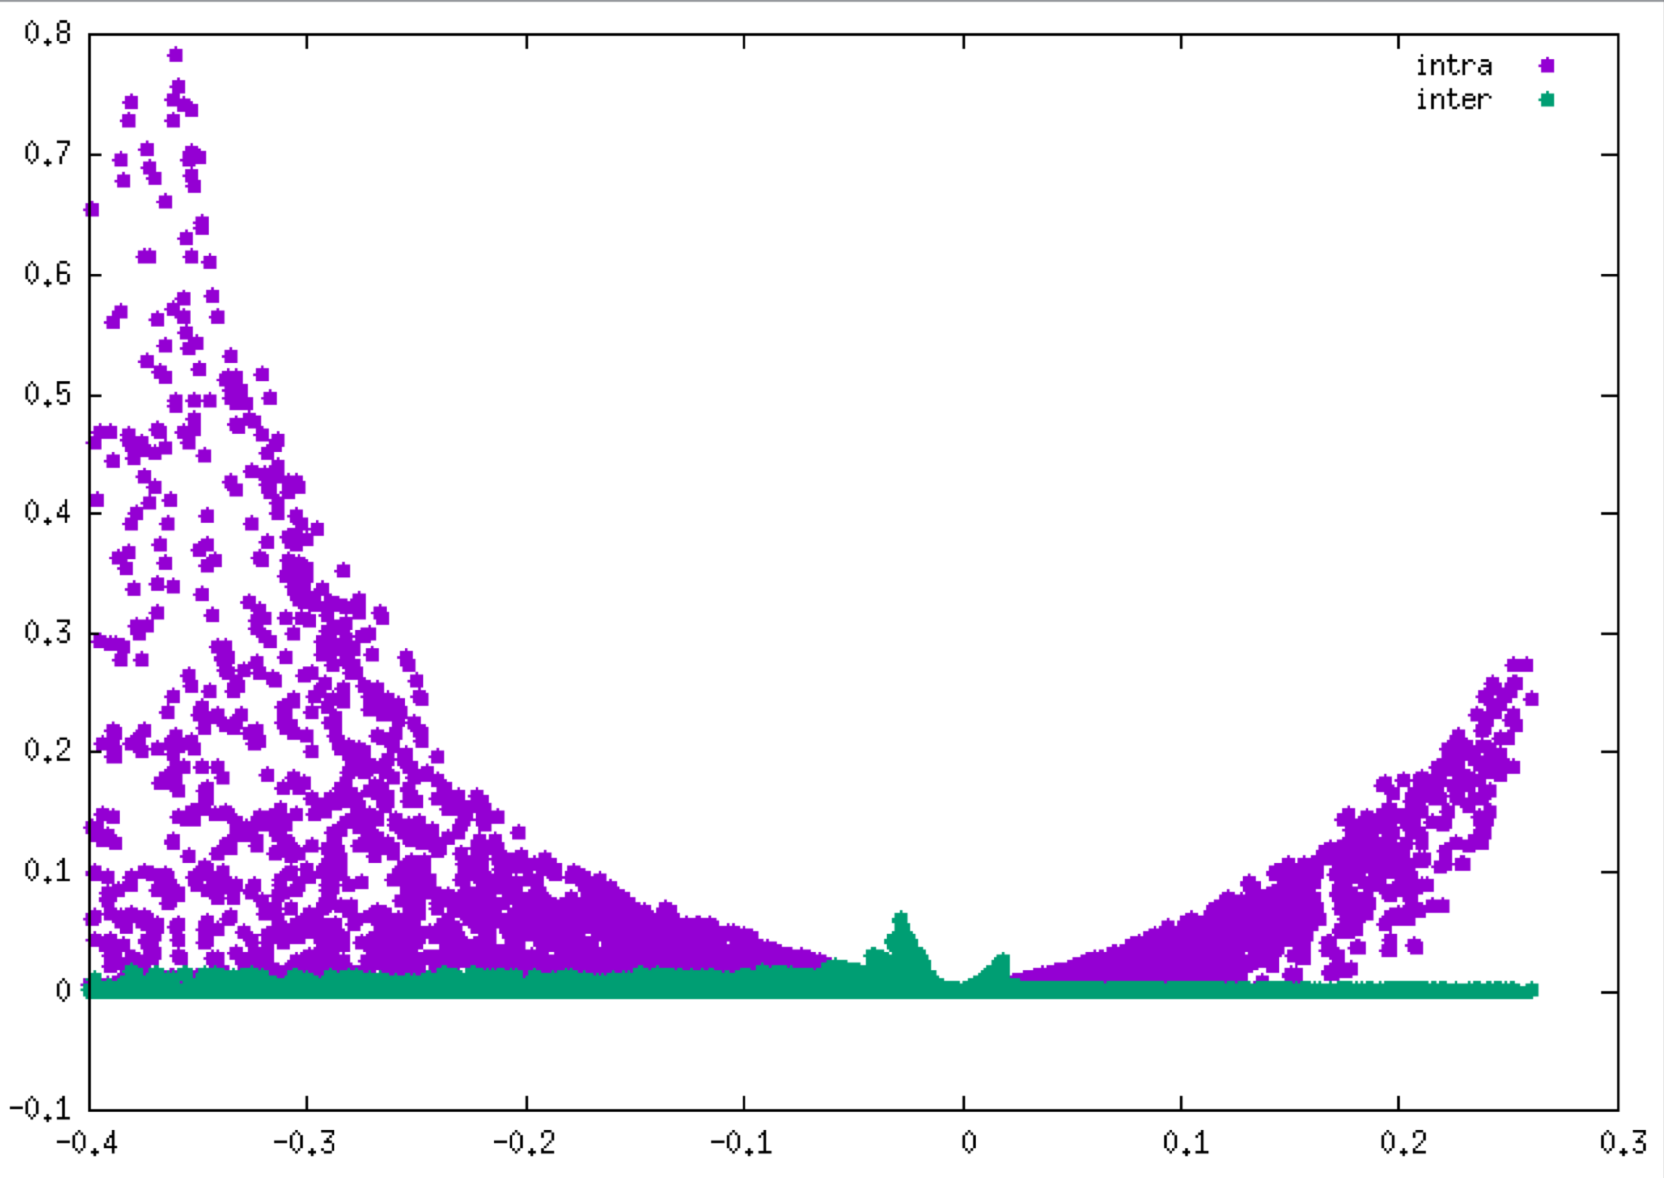
As you can see, IGMPlot has automatically isolated the two peaks.
QM or PROMOLECULAR modes: there are many advantages to define two fragments whenever it is possible.
3D-isosurfaces
Now that a fragment uncoupling scheme has been implemented (with the FRAG1 keyword), the generated vmd script igm.vmd allows you for separately draw isosurfaces corresponding to interactions inside each fragment (0:dg-intra.cube) or between the two fragments (0:dg-inter.cube).Using VMD, drawing the δg_inter isosurfaces (using the same procedure as explained above, loading the igm.vmd script in VMD) shows a "hydrogen-bond" envelop (disc-shaped) very similar to the one previously obtained at the promolecular ED level.
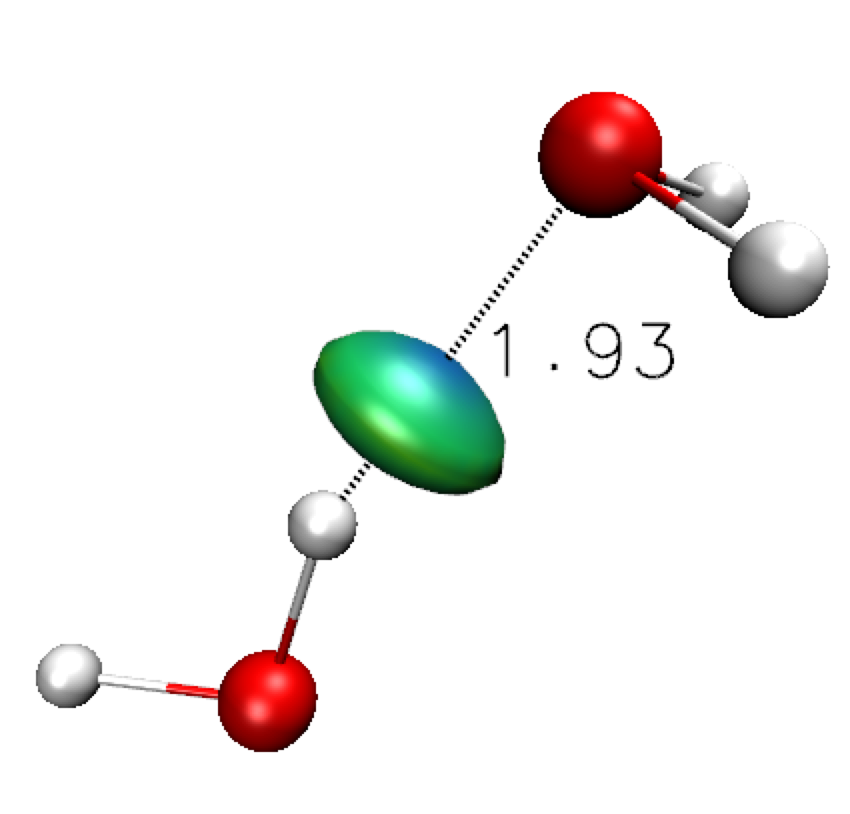
It is expected since in the very low ED domain, QM and promolecular descriptions of the ED have similar features (in contrast to features in the covalent domain).